
Articul8 Introduces New Domain-Specific Agents on Gemini Enterprise, Expanding Enterprise Understanding of Tables and Diagrams
With the launch of its Table Understanding Agent and Diagram Understanding Agent on Gemini Enterprise, Articul8 is helping enterprises transform complex documents and diagrams into structured, machine-readable intelligence that general-purpose AI still struggles to interpret reliably.
Gemini Enterprise is Google Cloud’s advanced agentic platform, built with Google’s expertise in secure, enterprise-grade solutions. With built-in security, governance, and a no-code workbench for building and sharing custom agents, Gemini Enterprise is designed to help organizations transform how work gets done at scale.
That is what makes this launch significant. Articul8 is introducing two new agents on Gemini Enterprise: the Table Understanding Agent and the Diagram Understanding Agent. Together, they expand how enterprises can convert information-dense artifacts into structured intelligence that downstream systems can actually use.
Some of the most important knowledge inside organizations lives in dense tables, engineering schematics, network topologies, process flow diagrams, CAD drawings, and other multimodal assets where meaning depends on structure, hierarchy, and relationships.
The Table Understanding Agent addresses one of the most persistent bottlenecks in enterprise AI: converting complex, irregular tables into structured, analytics-ready data. Rather than flattening tables into disconnected text, the agent reconstructs hierarchies, merged cells, contextual relationships, and formatting cues that traditional OCR and RAG pipelines often miss. In complex enterprise tables, those traditional approaches often capture only 30–50% of the information encoded in the source, while Articul8’s multimodal approach is designed to recover specific structural detail and preserve the semantics needed for trustworthy downstream use.
That matters because enterprise tables rarely arrive in neat, standardized formats. Financial filings combine narrative and dense tables. Engineering specifications include multi-level headers, merged cells, and abbreviated notation. Compliance reports embed footnotes within table spans. Operational logs extend tables across multiple pages. The Table Understanding Agent was built for exactly this kind of real-world complexity, delivering structured outputs that are ready for analytics, compliance workflows, and domain-specific reasoning. It can detect table regions, reconstruct hierarchy, normalize values and units, and stream structured data in real time for downstream systems.
Building on that foundation, the Diagram Understanding Agent extends Articul8’s domain-specific approach to one of the most difficult challenges in industrial AI: turning complex engineering diagrams into structured, machine-readable intelligence that enterprises can use for automation, troubleshooting, validation, and decision-making.
Why Diagram Intelligence Has Been So Hard
Diagram understanding sits at the intersection of several unsolved challenges in AI. It is worth being precise about what makes engineering diagrams so difficult.
Symbolic, spatial, and semantic complexity
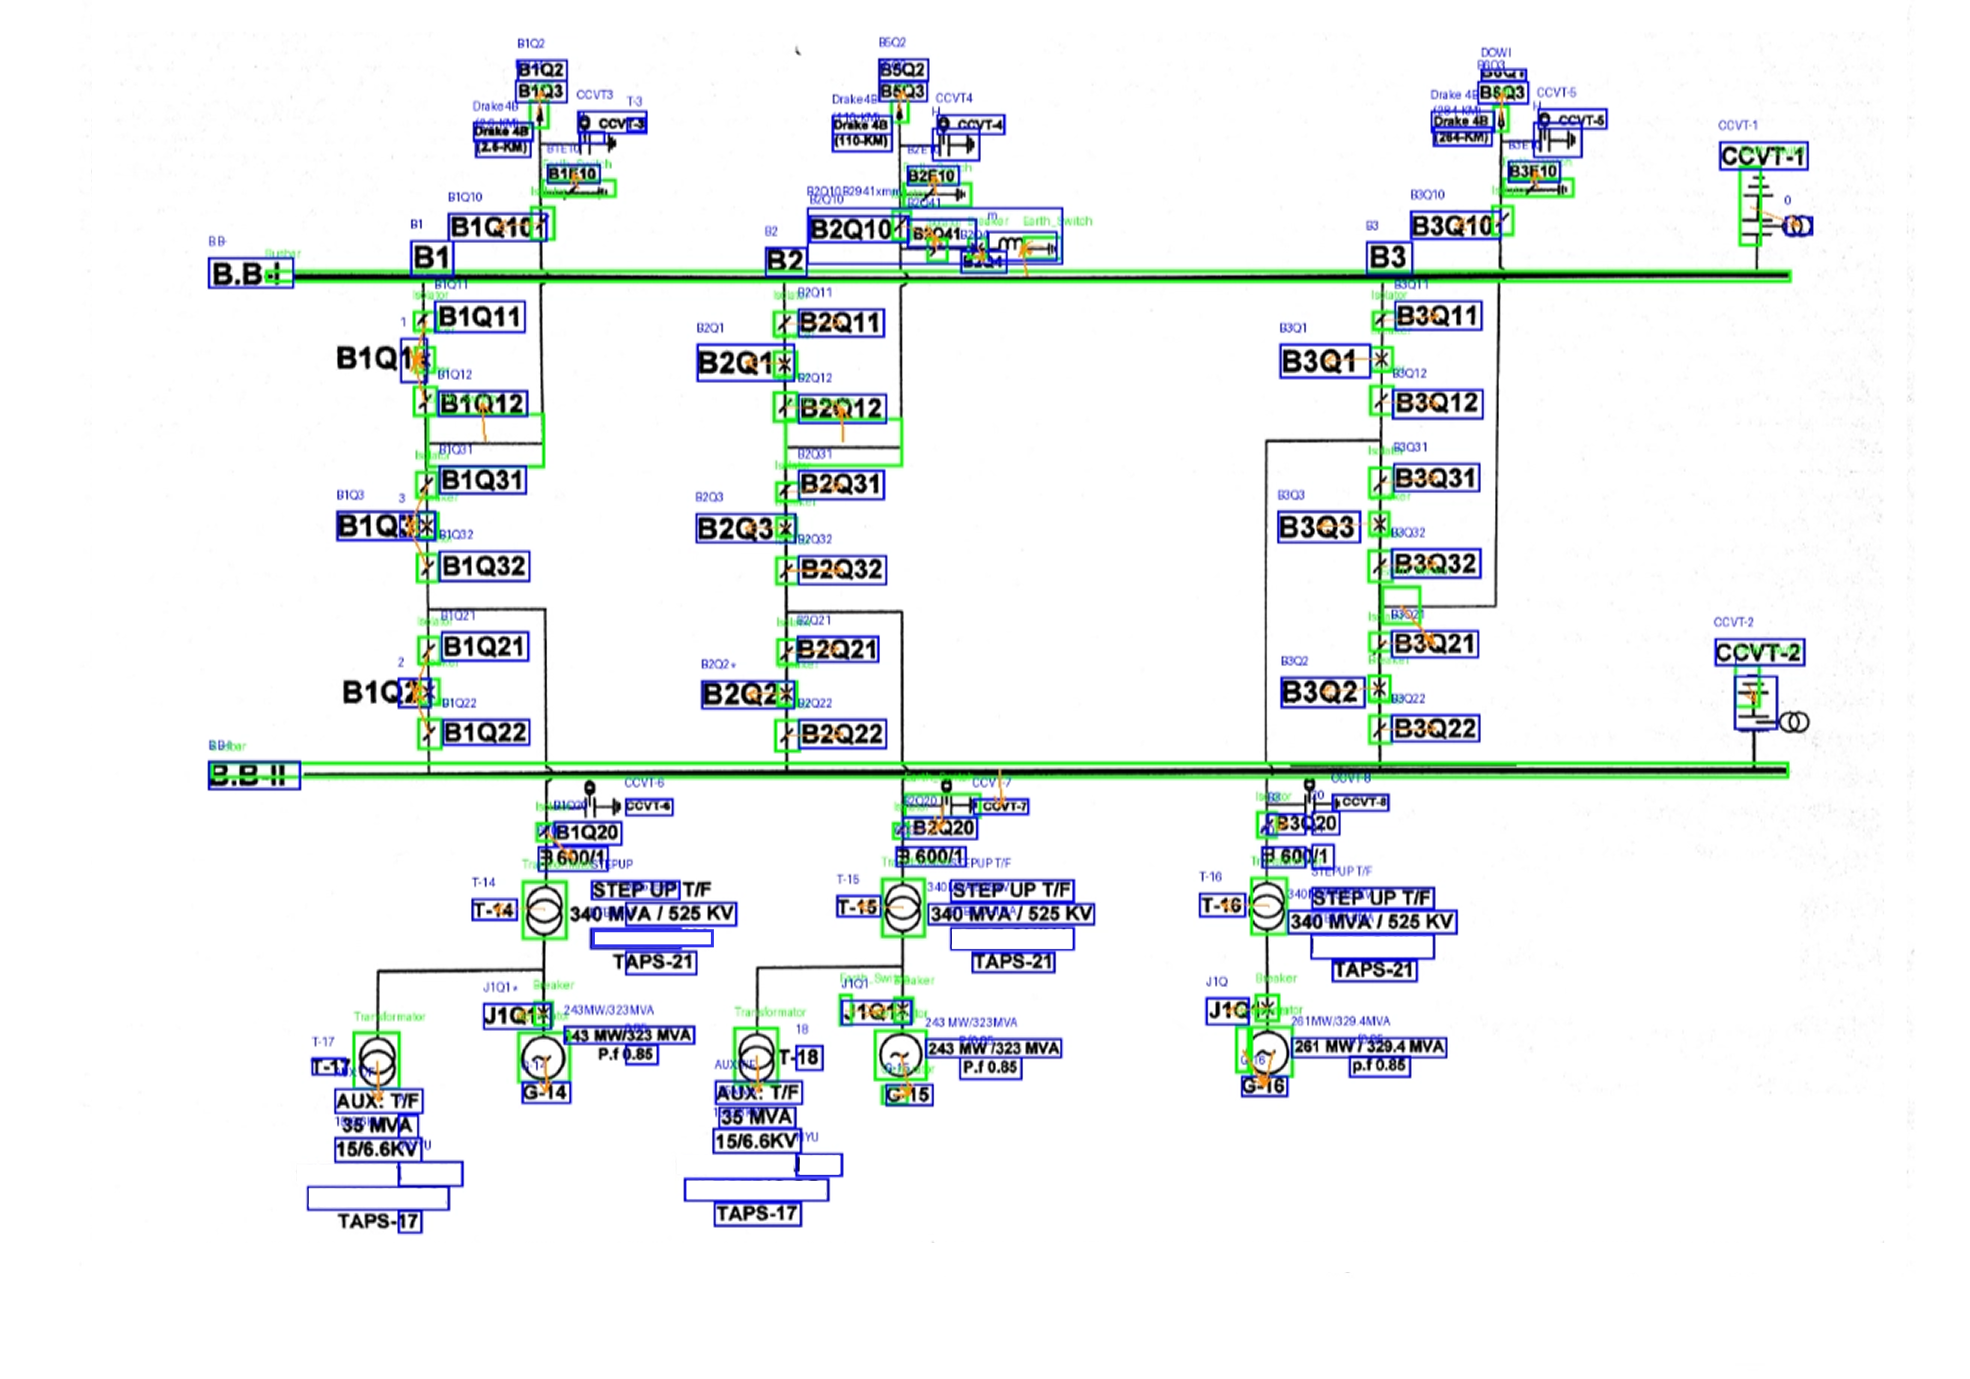
Diagrams combine visual symbols (icons, shapes, lines), spatial relationships (proximity, connectivity, hierarchy), and embedded text (labels, IDs, annotations). Single Line Diagrams, the canonical example, represent electrical networks using standardized symbolic notation across a compressed, information-dense canvas. A single SLD may show a full substation: buses, breakers, transformers, relays, disconnects, grounding, and measurement points, with each symbol carrying structural meaning and each label cross-referencing an external signal sheet or equipment register.
Traditional models struggle because they treat diagrams as flat images, miss relational meaning between components, and fail to reconstruct system-level logic. The number and size of electrical symbols on SLDs are also highly imbalanced. Devices such as generators and power transformers are few but drawn at large scale. In contrast, circuit breakers and disconnectors are often drawn at much smaller sizes, creating class imbalance problems that degrade the performance of standard detection models.
Disconnected multimodal context
In real-world engineering workflows, diagrams live in PDFs or scanned images while supporting data lives in spreadsheets, signal logs, or asset databases. The intelligence emerges only when these are connected, something legacy pipelines don't handle well. When modeling a power system from an SLD, engineers must place electrical symbols in appropriate locations, construct the circuit topology, and manually enter model parameters, all based on information spread across these disconnected sources. This process is time-consuming and prone to errors.
The challenge is compounded by scan quality. Many operational SLDs are legacy documents, produced years or decades ago, existing only as low-resolution raster images with faded ink and misaligned annotations. Many critical engineering artifacts, including P&IDs and process design documents, are either outdated or entirely unavailable. This documentation gap makes the challenge even more acute: AI systems trained on pristine, well-formed diagrams break down in real-world brownfield deployments where legacy documents are the norm.
Engineering-grade precision requirements
Unlike general AI use cases, diagram interpretation demands near-perfect accuracy, deterministic mappings, and traceable reasoning. A single misinterpreted connection can lead to faulty system design, incorrect troubleshooting, and operational risk. Across the industry, the result is predictable: SLD validation becomes a bottleneck, project timelines slip, and mapping errors propagate into downstream SCADA configuration, asset management systems, and maintenance planning.
The Shift: From Diagram Parsing to Diagram Understanding
The Diagram Understanding Agent represents a fundamental shift in what AI can do with engineering documents.
It enables multimodal reasoning grounded in domain context. The agent treats engineering diagrams as semantic documents, where the meaning of any element depends on its relationships to every other element, and where visual data must be continuously reconciled against tabular signal data, equipment registers, and domain conventions.
Now on Gemini Enterprise: Deploy in Your Existing Cloud Environment
Now available on Gemini Enterprise, the Diagram Understanding Agent makes this capability accessible within a broader enterprise agentic environment. Organizations can bring diagram intelligence into workflows that already rely on secure, enterprise-grade AI for search, analysis, summarization, and automation. That means teams can move more quickly from static engineering artifacts to structured, usable intelligence without forcing diagram interpretation into tools that were never designed for this level of precision.
Enterprises can start with a targeted deployment on a specific diagram type or asset class and expand from there, applying the same capability across SLDs, P&IDs, network diagrams, and other engineering artifacts as the use case matures.
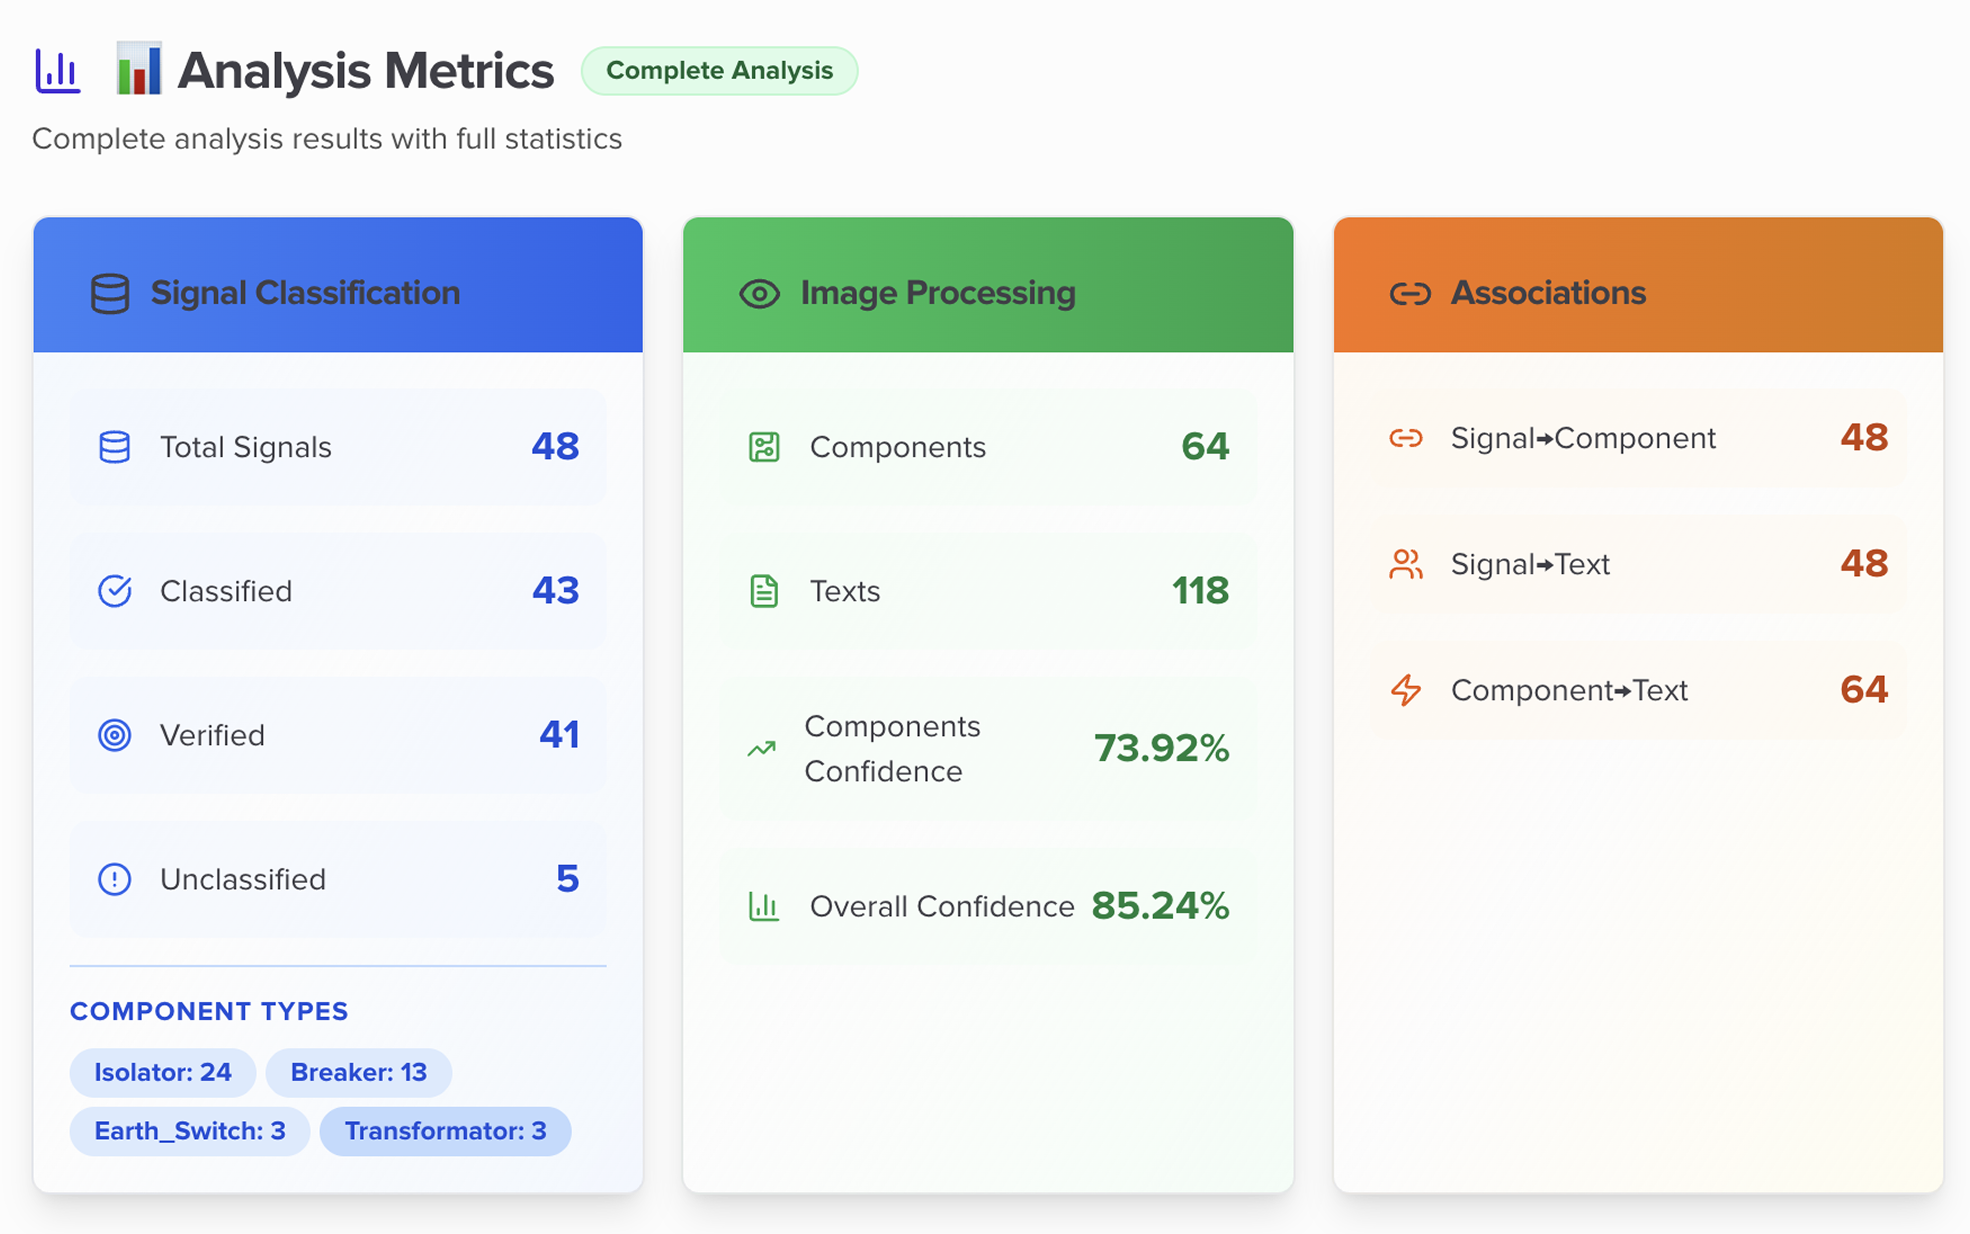
Key results from production deployments:
- 96% component classification accuracy with automated mapping
- Analysis time reduced from hours to minutes
- Full deployment achieved in minutes, not months
- Structured outputs including XML, visual diagrams, and topology maps for complete auditability
How the Agent Works: A Three-Agent Architecture
At its core, the Diagram Understanding Agent operates as a coordinated multi-agent mission, where each agent specializes in a distinct layer of understanding. The three agents form a complete intelligence pipeline from raw diagram ingestion to structured, auditable output.
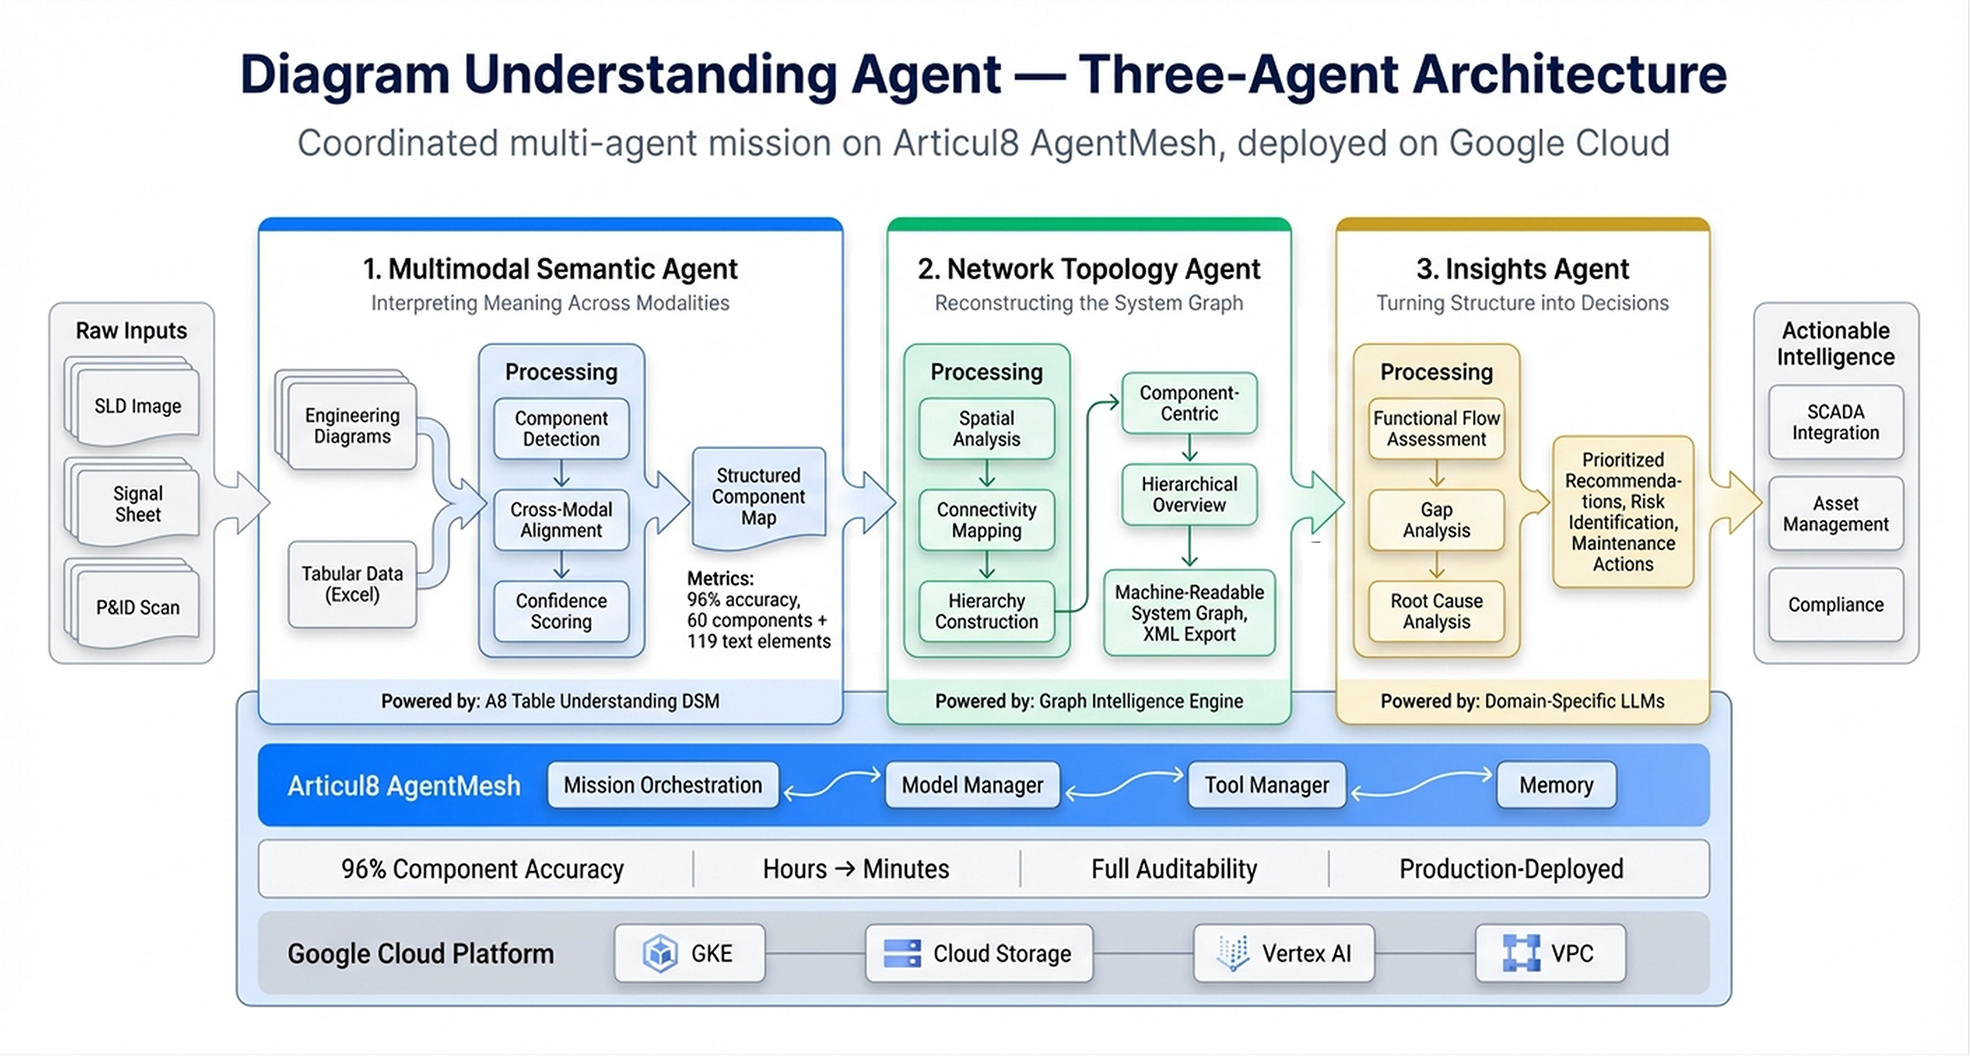
1. Multimodal Semantic Agent: Interpreting Meaning Across Modalities
The foundational layer of the system. The Multimodal Semantic Agent processes engineering diagrams and associated tabular data, such as Excel signal sheets, simultaneously. It identifies, classifies, and standardizes components from both visual content and metadata, creating logical connections between headers, signal names, and visual layout.
The agent performs component detection and classification, cross-referencing between visual elements and tabular data, and semantic alignment across sources. The result is a coherent, structured representation of the system, not just extracted text. Critically, it assigns confidence scores to each association, providing transparent, verifiable validation that engineers can inspect and trust.
This agent was purpose-built using our Table Understanding Domain-Specific Model to meet the precision requirements of engineering-grade diagram analysis, operating well beyond the accuracy ceiling of general-purpose vision models. In production deployments, it has correctly mapped Excel components with 96% accuracy, compared to 84% achieved using state-of-the-art (SOTA) models such as Claude Opus 4.6, and GPT-4 and extracted specific symbolic components and domain-specific text elements from complex SLDs with 94% retrieval accuracy compared to 77% from SOTA models.
2. Network Topology Agent: Reconstructing the System Graph
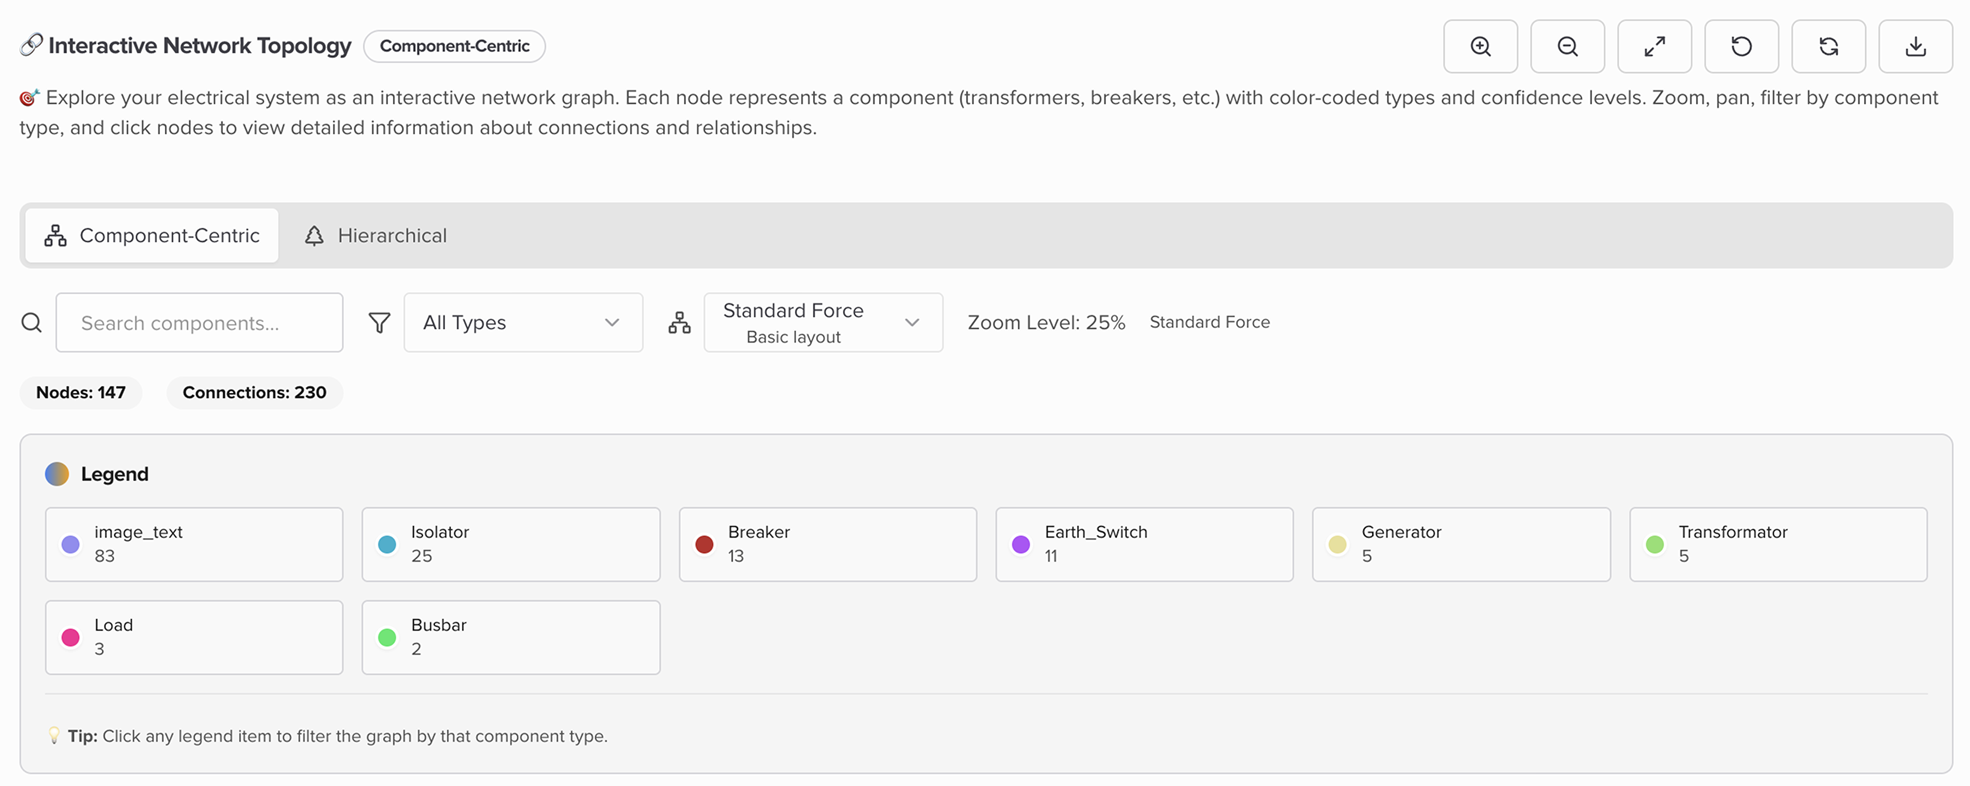
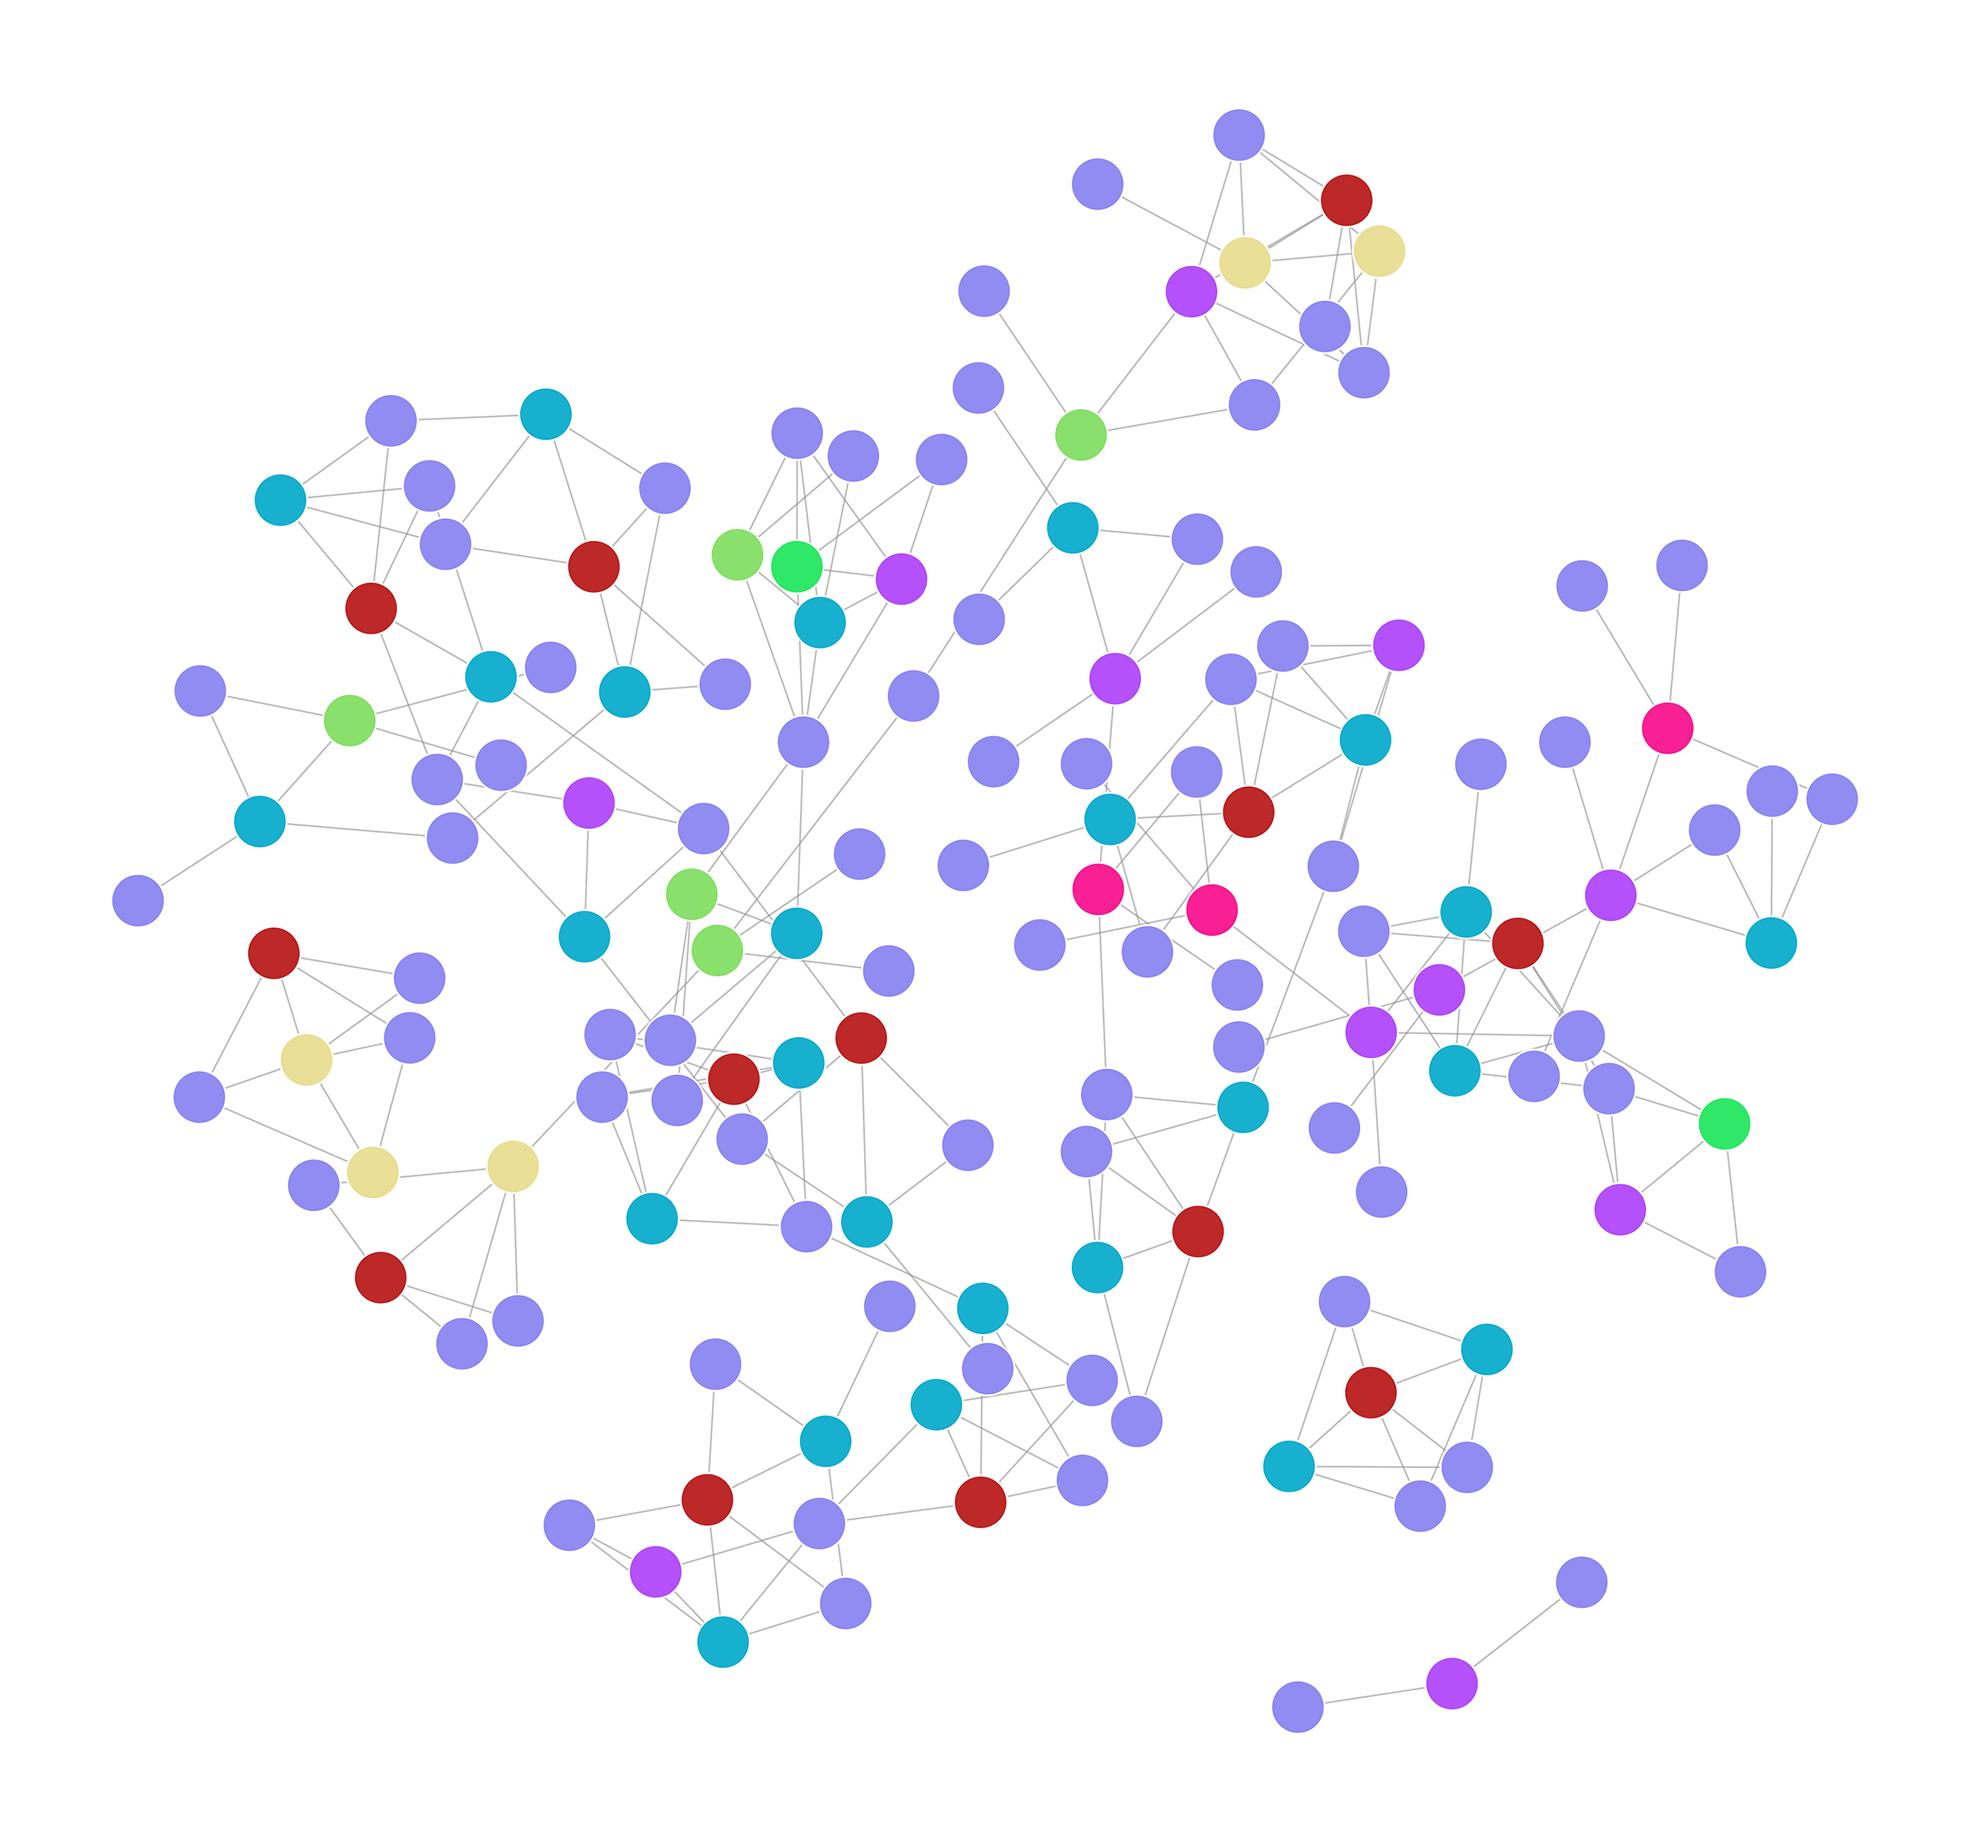
Once components are identified, the next challenge is understanding how everything connects. The Network Topology Agent builds a machine-readable graph of the infrastructure by automatically connecting stations, subnets, bays, equipment, and signals into a unified digital model, transforming static diagram data into a dynamic, queryable representation of the system.
Engineers gain instant visibility into system dependencies, automated connectivity mapping, and structured outputs ready for integration with downstream platforms. The agent generates two complementary views: a component-centric view for precise local diagnostics and a hierarchical overview showing every connection from station level down to individual signals. Outputs include structured XML exports with full signal associations for direct integration into monitoring, SCADA, and asset management platforms.
Through sophisticated spatial analysis, the agent reveals relationships between components and text elements, helping engineers quickly identify root causes of network issues. Its confidence-based ranking system streamlines troubleshooting by automatically highlighting the most uncertain or critical areas for review.
3. Insights Agent: Turning Structure into Decisions
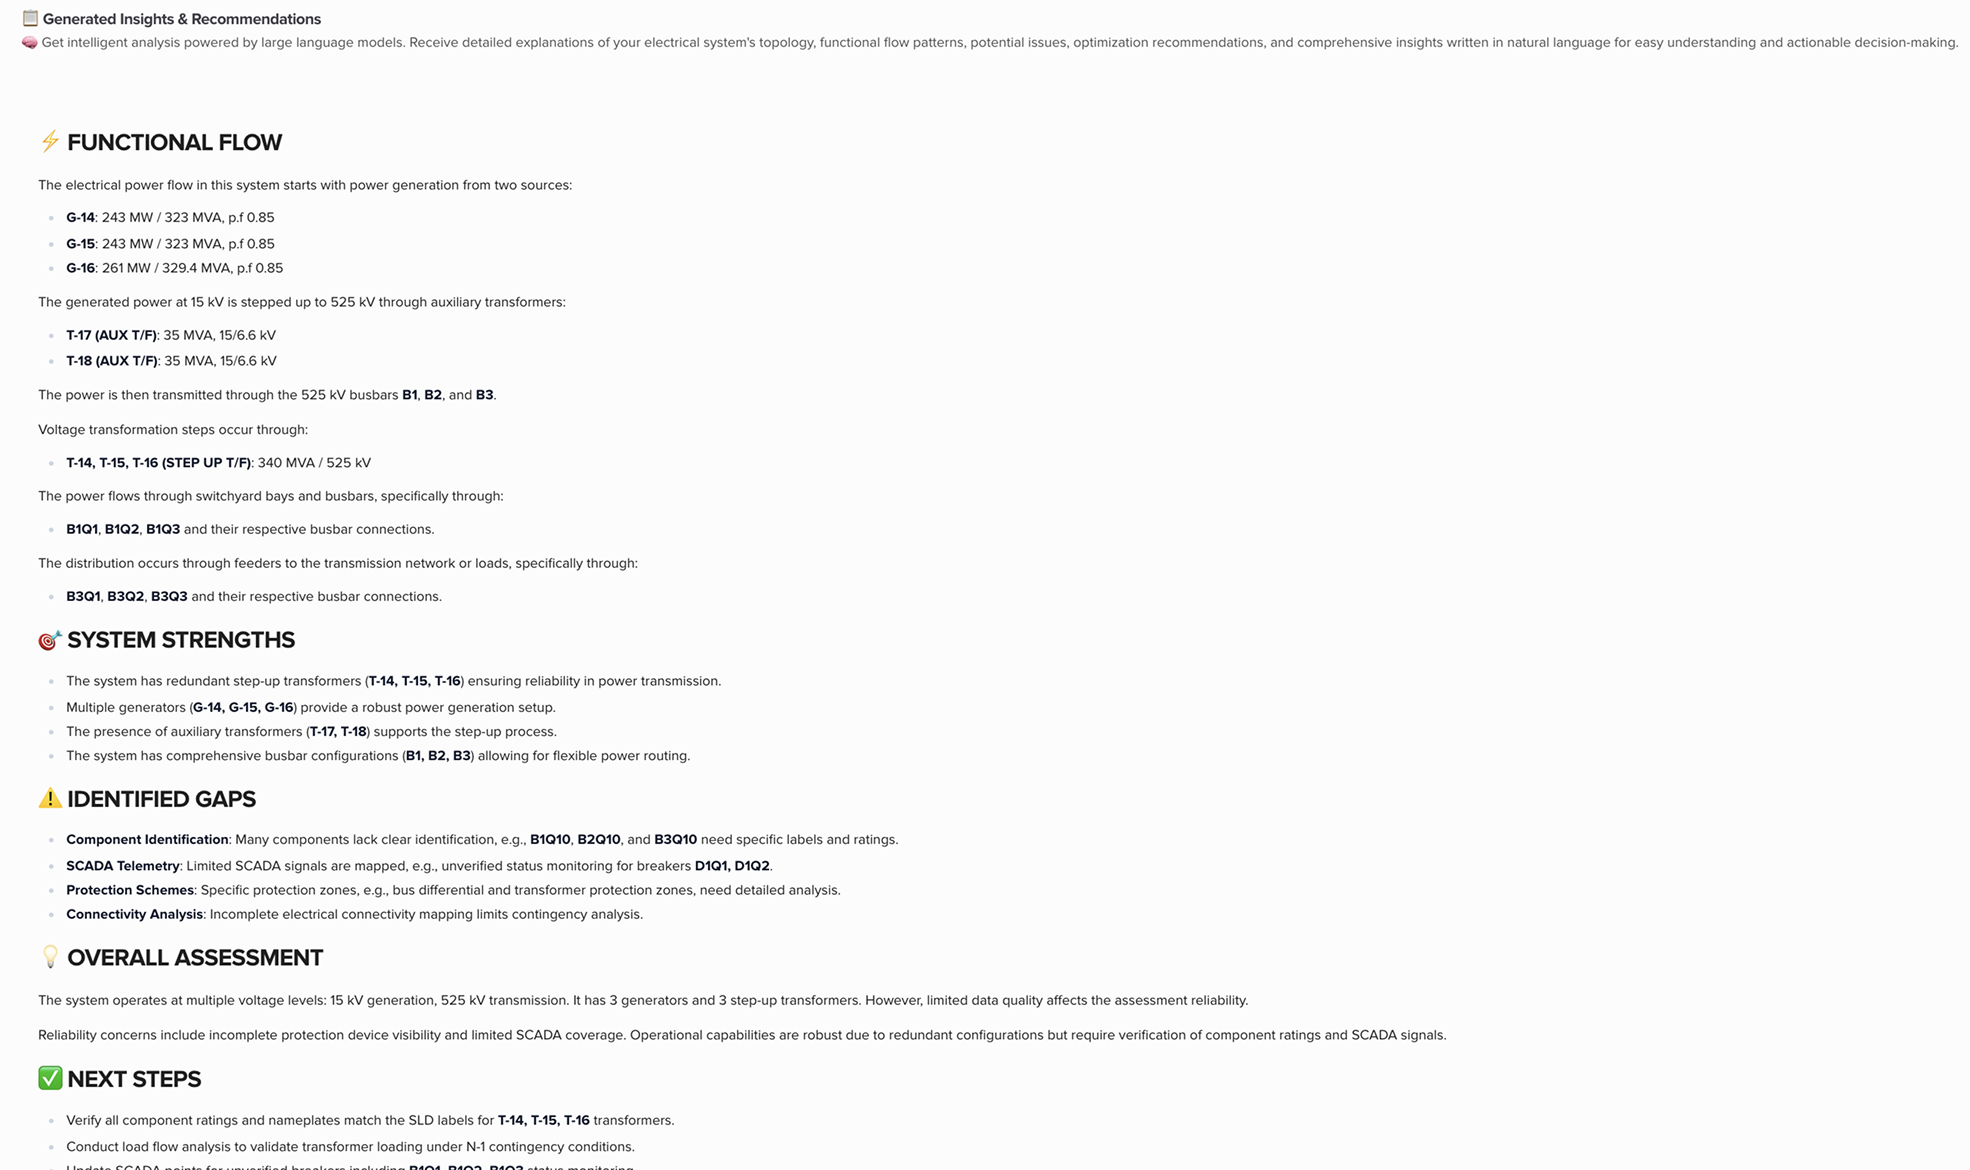
The final layer moves from understanding to intelligence. The Insights Agent receives the structured outputs of both upstream agents and transforms them into actionable engineering intelligence.
It synthesizes multimodal data to perform functional flow assessments, strength analysis, gap identification, and root cause analysis across stations, subnets, and equipment hierarchies. It then converts those findings into prioritized recommendations: where to optimize network performance, which components present reliability risk, and what maintenance actions to take next.
This is where diagram intelligence becomes decision intelligence, and where the agent moves from reading a diagram to driving an outcome.
The Performance Boost that makes AI Useful for Industrial Applications: A8-TSM-Single Line Diagram vs. GPT-5.4
The central question enterprises face when evaluating AI for engineering diagram analysis is whether the model can process the diagrams with the accuracy and reliability that engineering workflows require. To answer that question directly, we ran a rigorous benchmark comparing Articul8's task-specific model powering the SLD applications, A8-TSM-Single Line Diagram, against GPT-5.4 as a representative SOTA general-purpose LLM.
How we tested
We used a set of publicly available SLD images, with no customer data included, and evaluated both models on their ability to precisely locate and identify the different components in each diagram. GPT-5.4 was prompted to detect SLD components and return bounding box coordinates, the same task A8-TSM-Single Line Diagram was designed and trained to perform.
For each image, predicted bounding boxes were compared against ground truth bounding boxes using Hungarian matching, a rigorous greedy assignment method. A prediction was counted as correct only when the predicted and ground truth bounding boxes had an Intersection over Union (IOU) greater than 0.5, a standard and demanding threshold for spatial accuracy. Precision and recall were computed per image and averaged across the full test dataset of 64 images containing 8,077 ground truth components.
The results
| Model | Precision @ IOU 0.5 | Recall @ IOU 0.5 |
|---|---|---|
| GPT-5.4 | 0.0079 | 0.0017 |
| A8-TSM-Single Line Diagram | 0.6999 | 0.7792 |
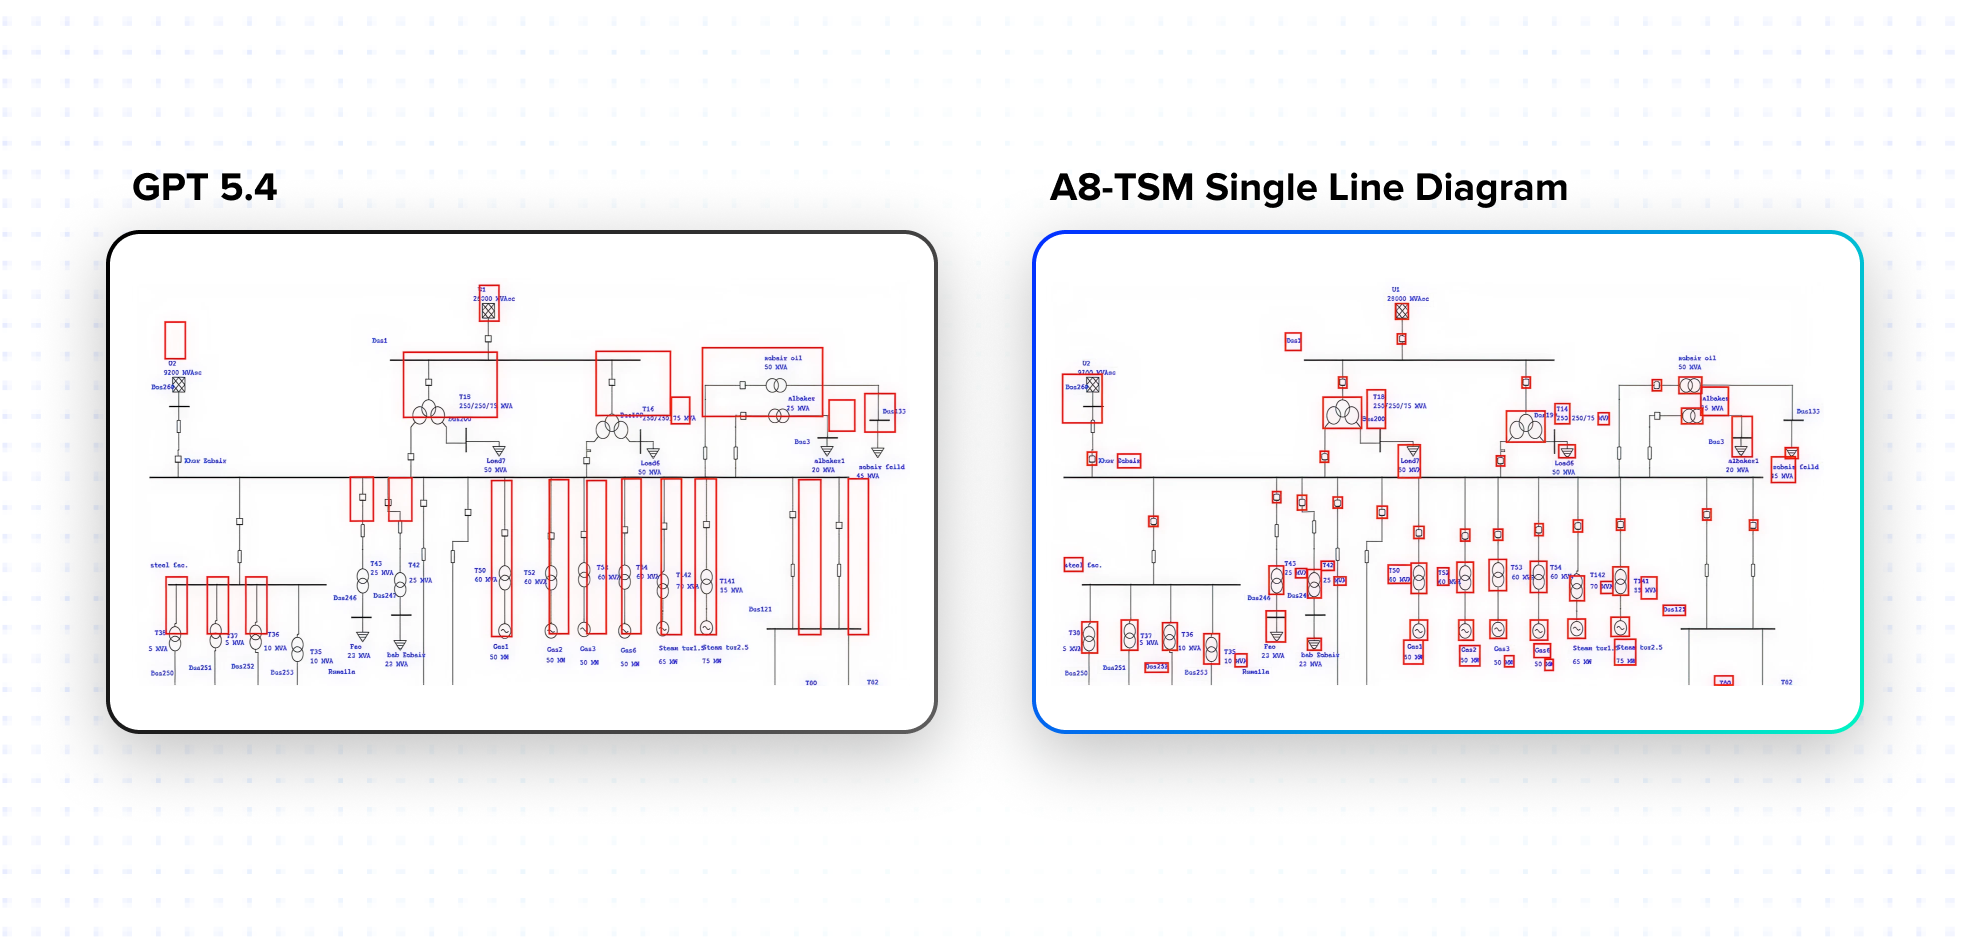
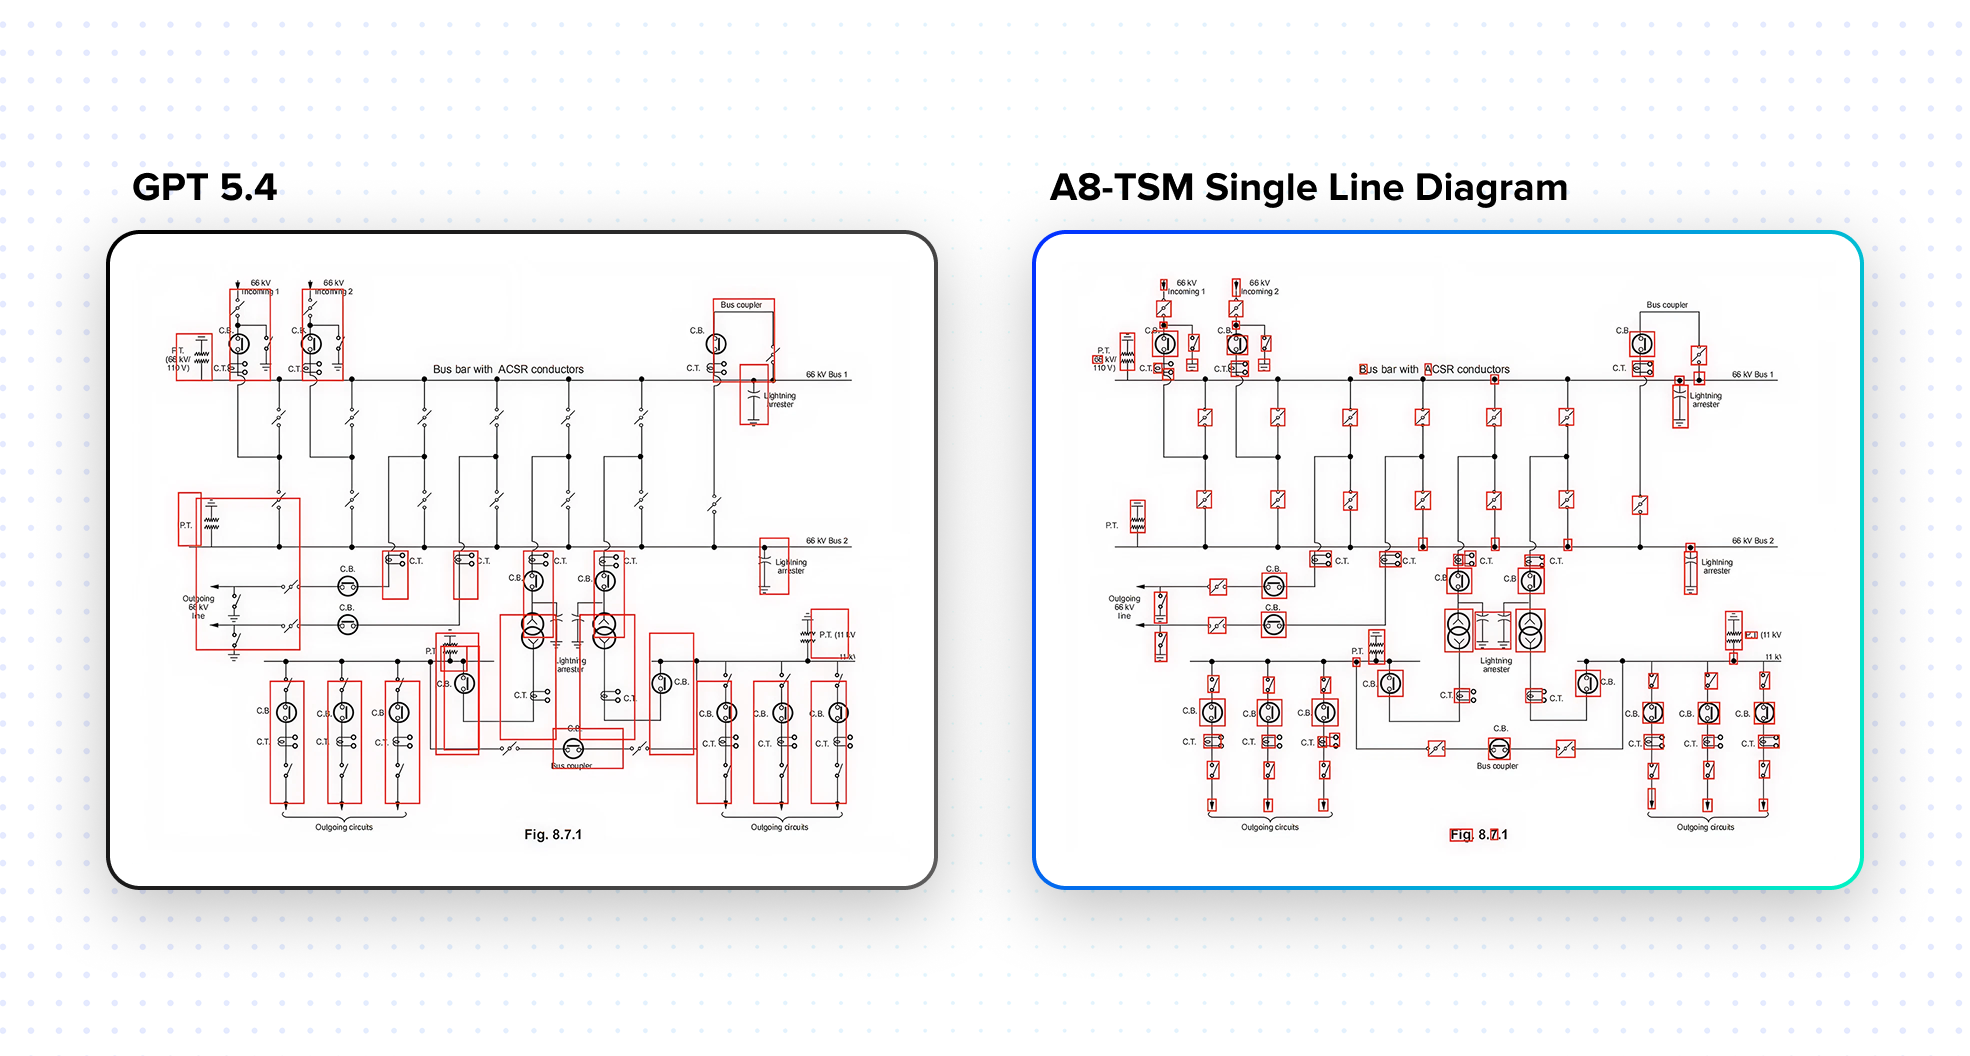
The gap is stunning! GPT-5.4, despite being one of the most capable general-purpose commercial models available, achieved a precision of less than 0.1% and a recall of less than 0.2% on this task. A8-TSM-Single Line Diagram achieved a precision of ~70% and a recall of ~78% across the same dataset.
This is not a comparison of a tuned model against an untuned one. GPT-5.4 was explicitly prompted for this task. The result reflects something more fundamental: SOTA general-purpose LLMs, despite their remarkable advances across a wide range of tasks, are not equipped to handle highly specific, precision-demanding engineering applications. SLD component detection requires spatial reasoning, domain-specific symbol recognition, and tolerance for imbalanced, noisy, legacy diagram formats that general models have simply not been built or trained to handle.
Examples
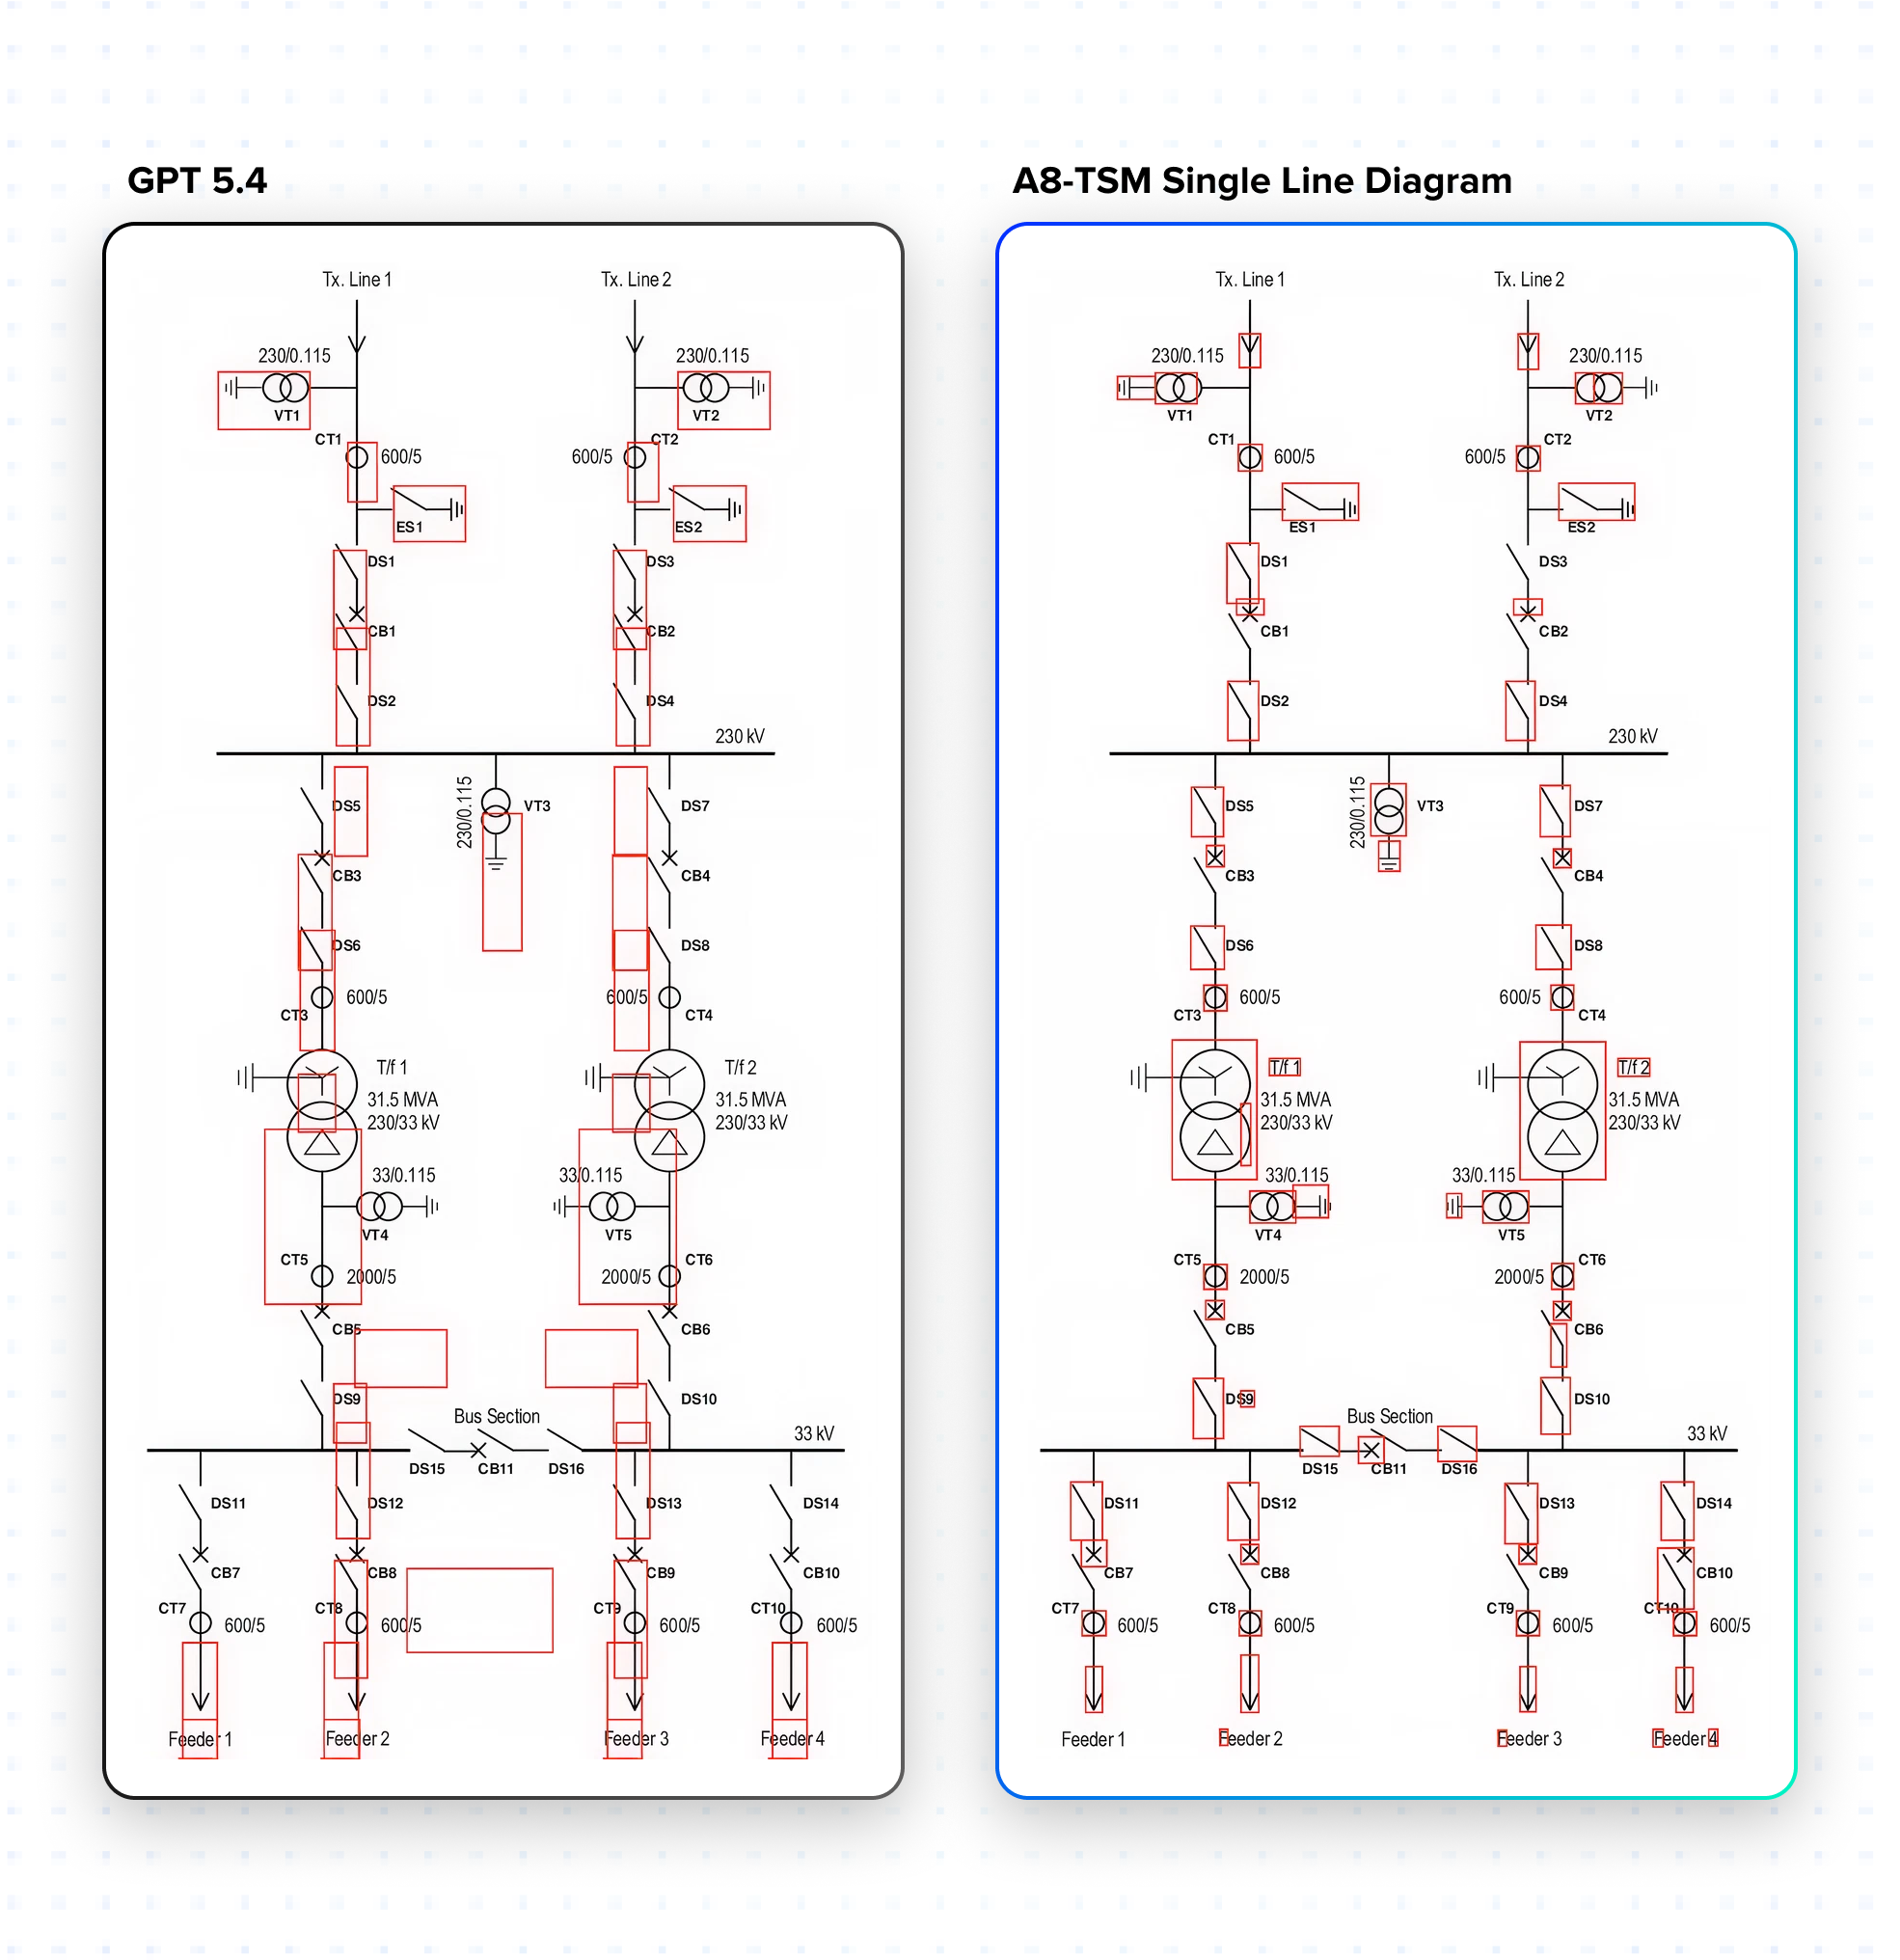
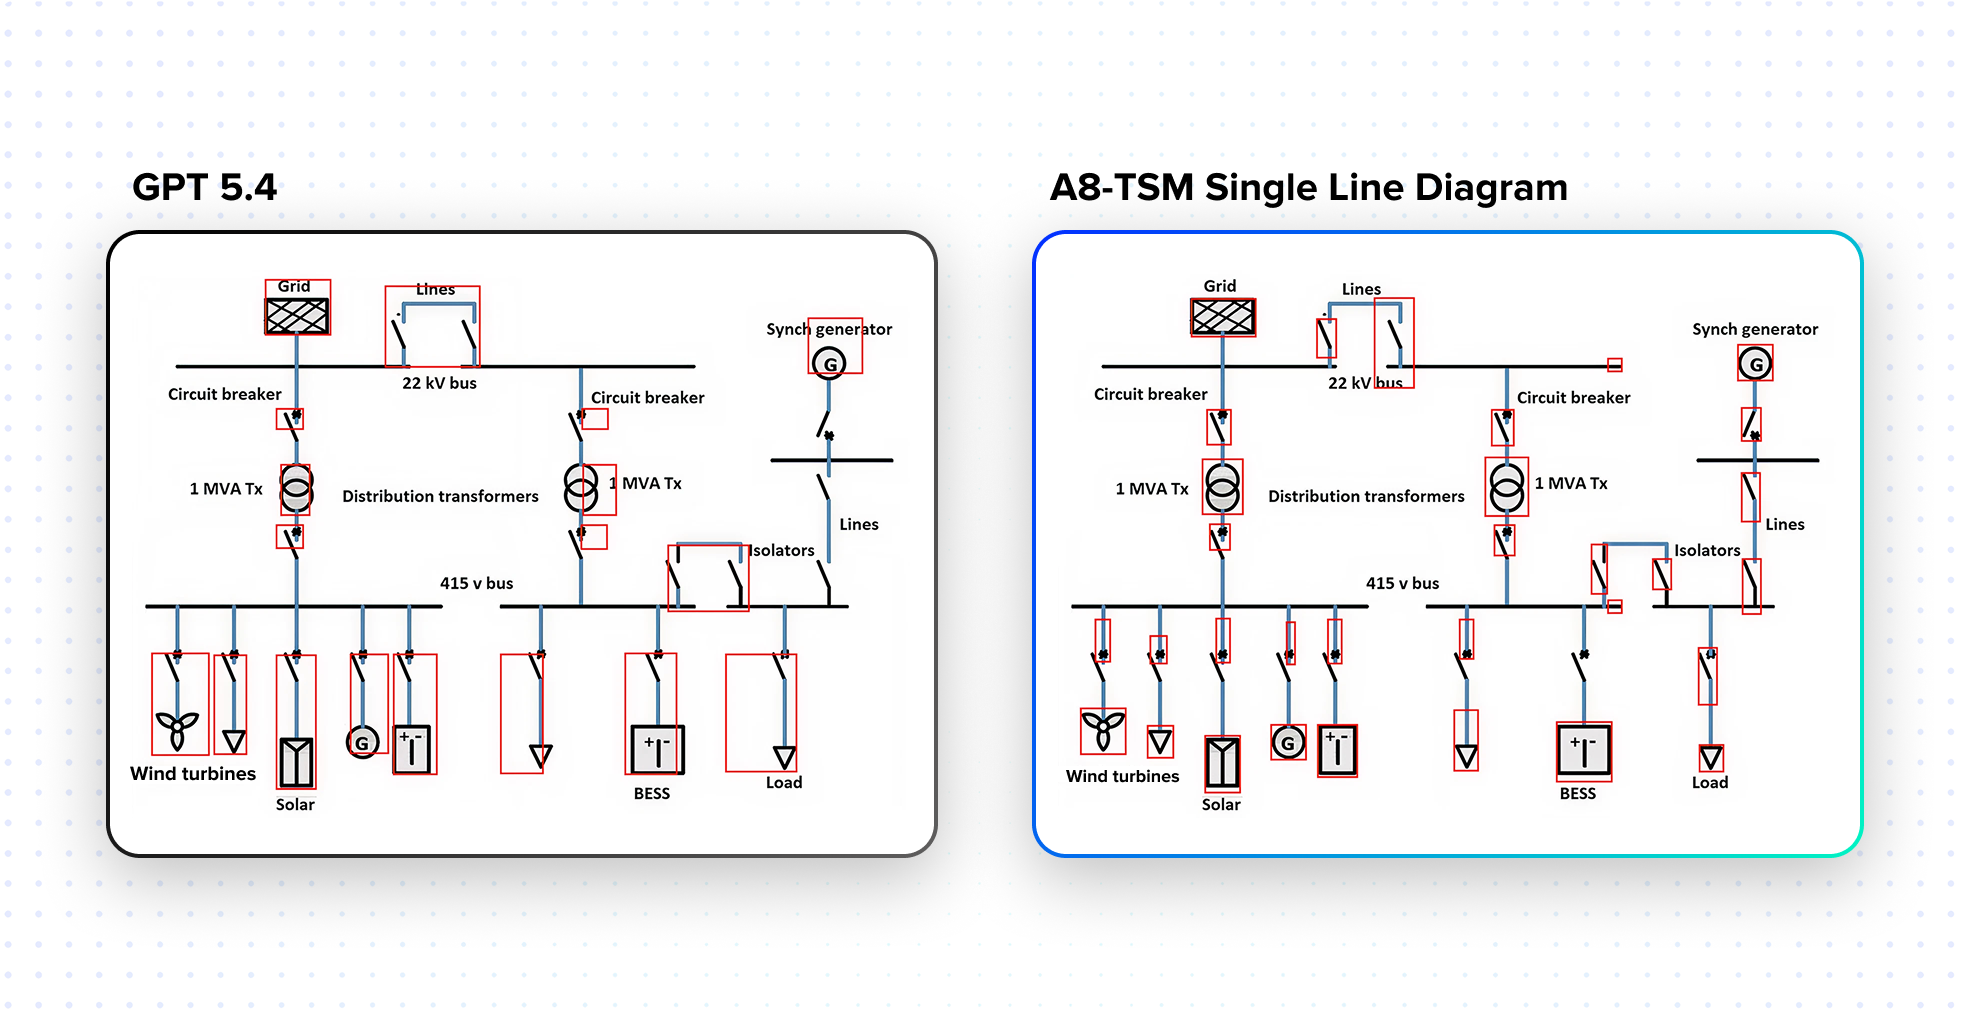
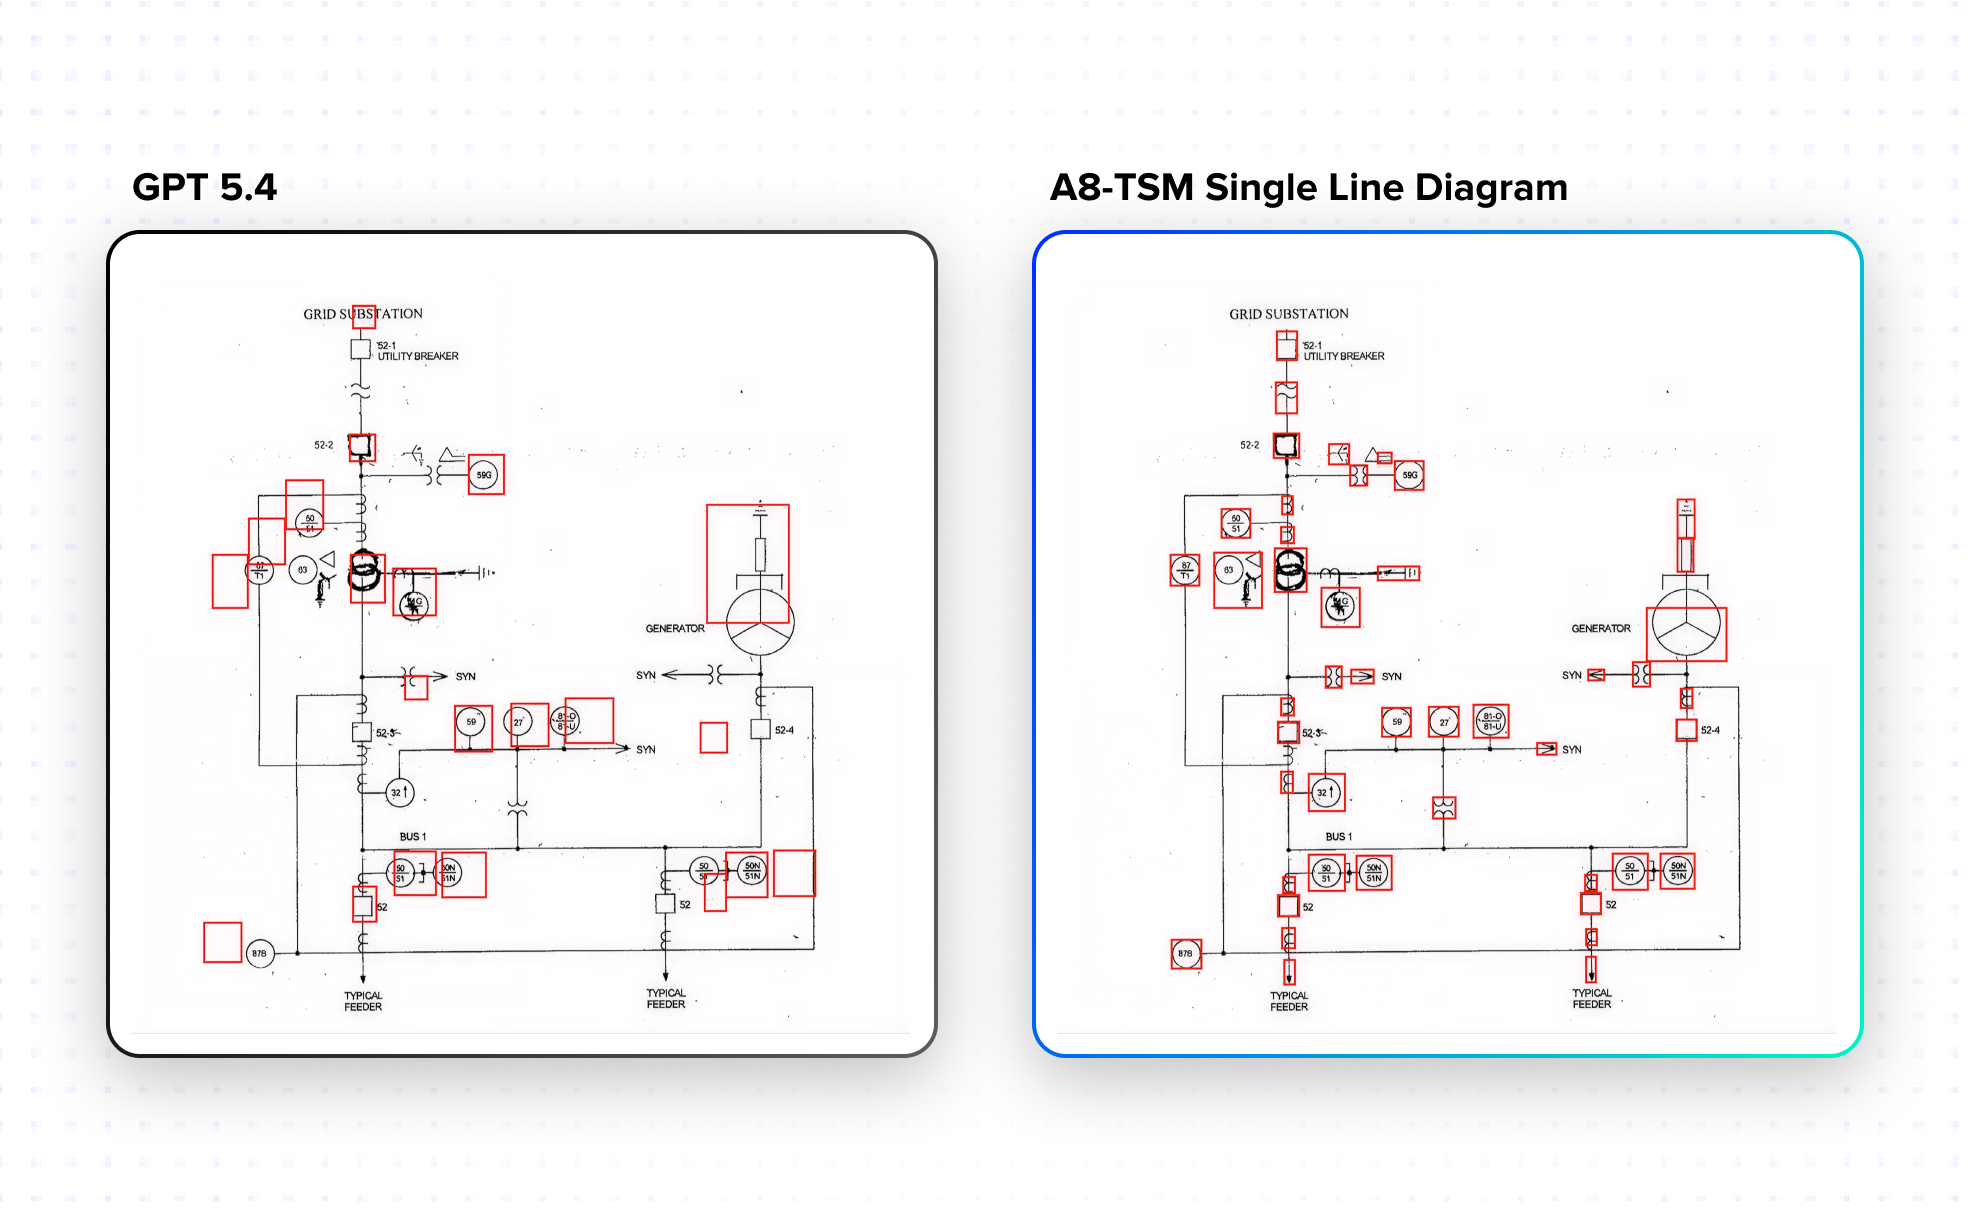
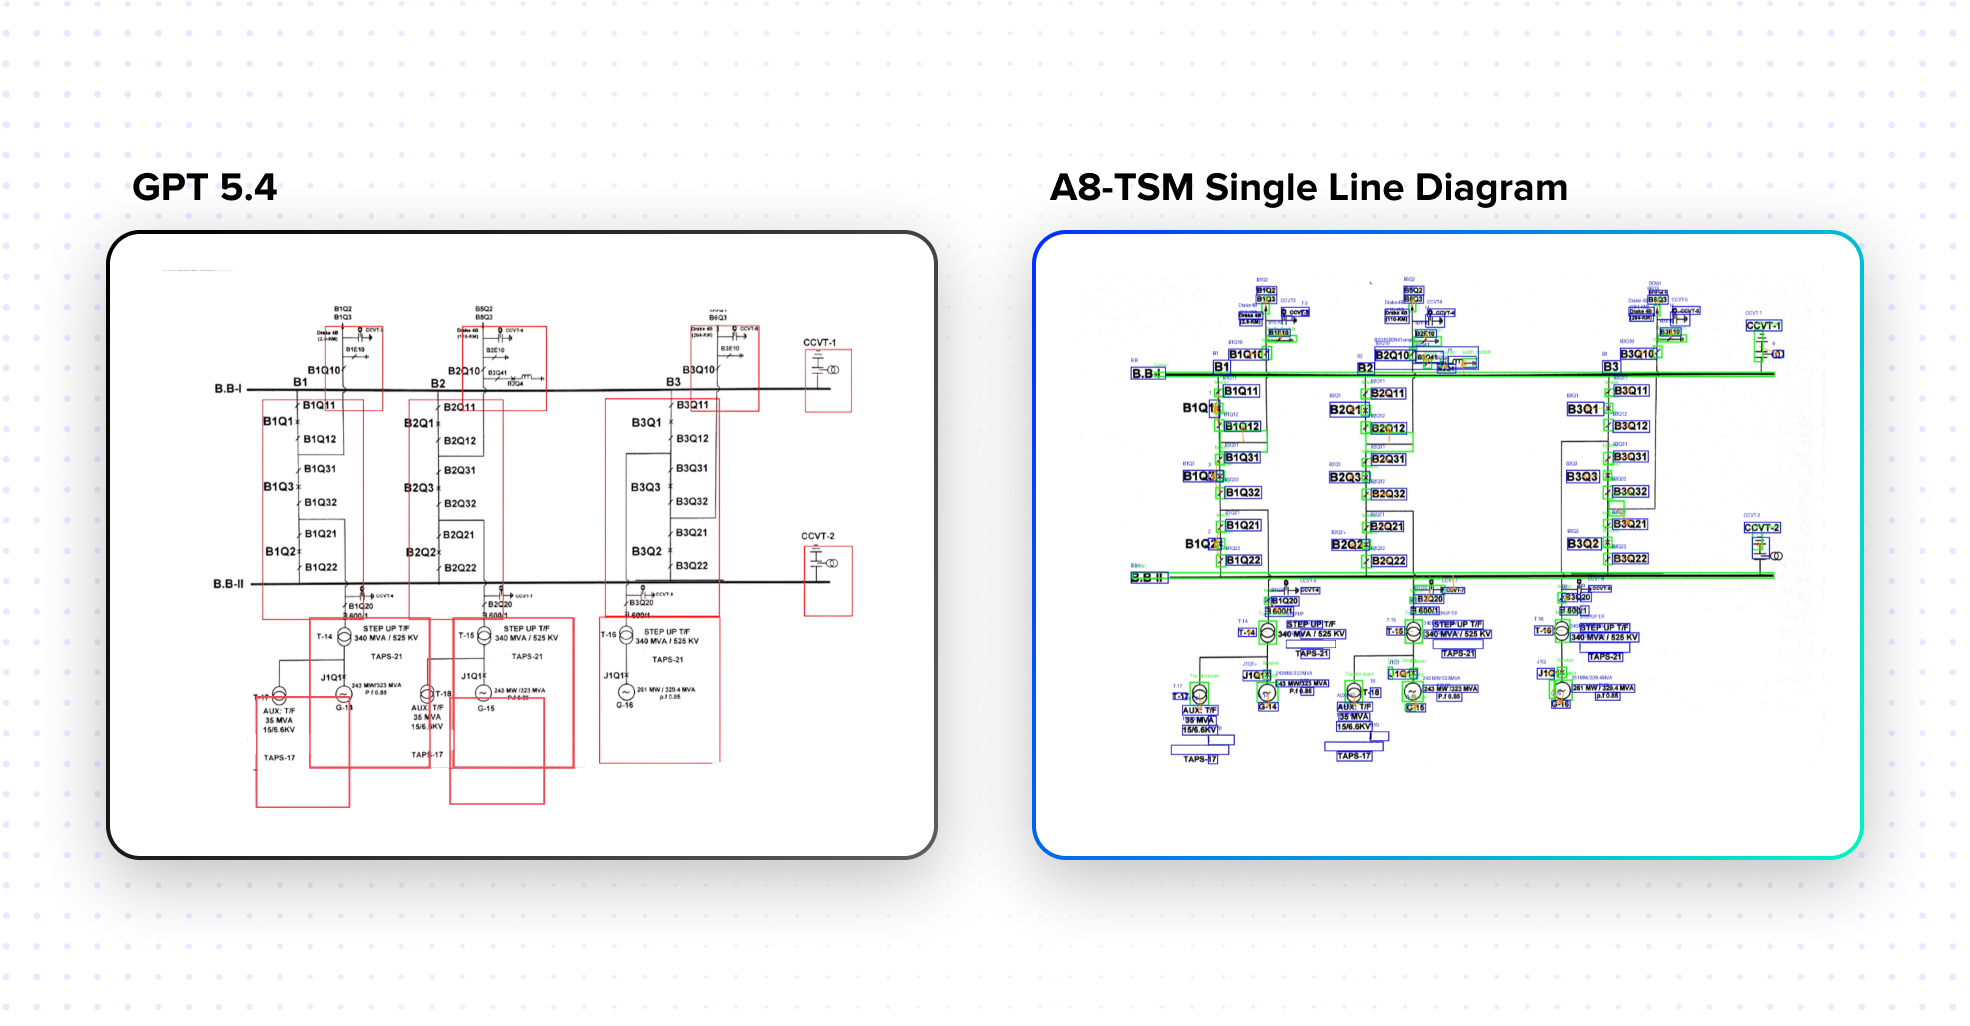
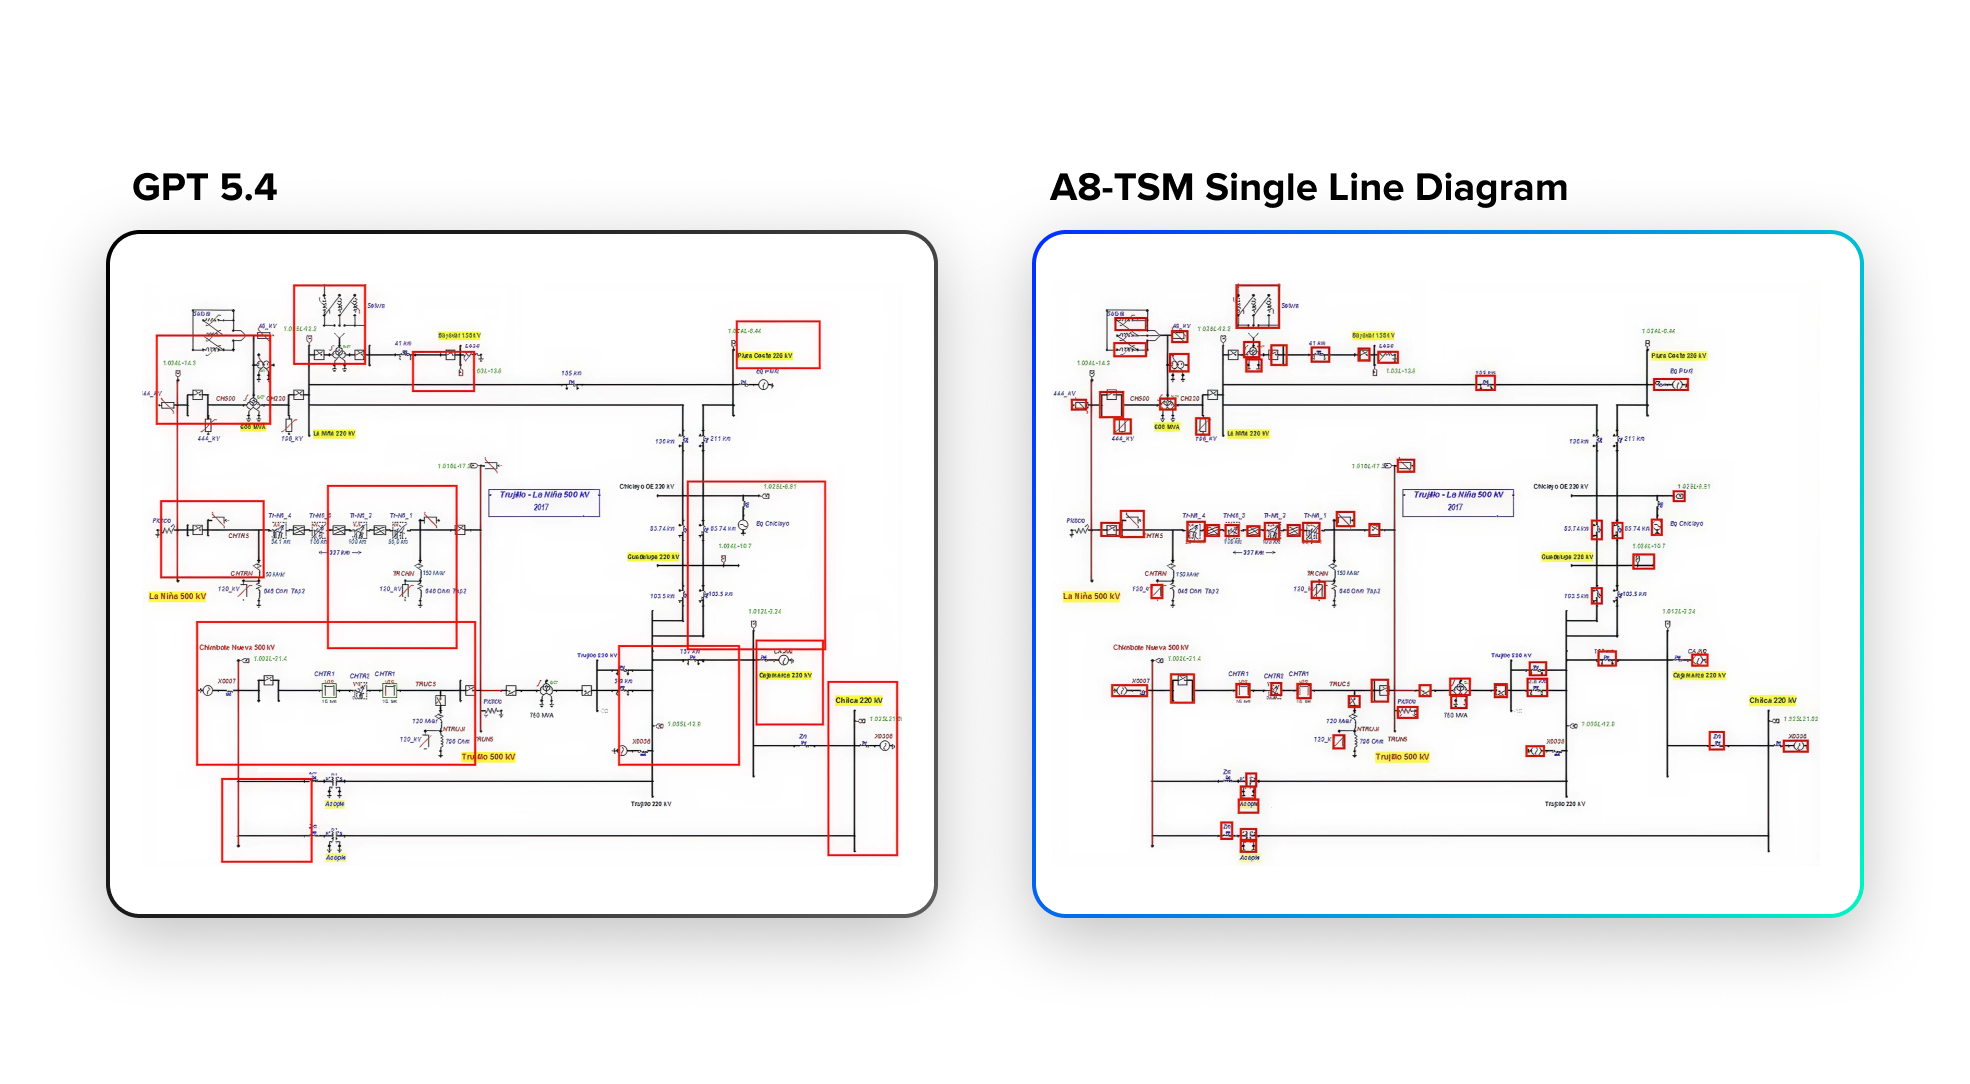
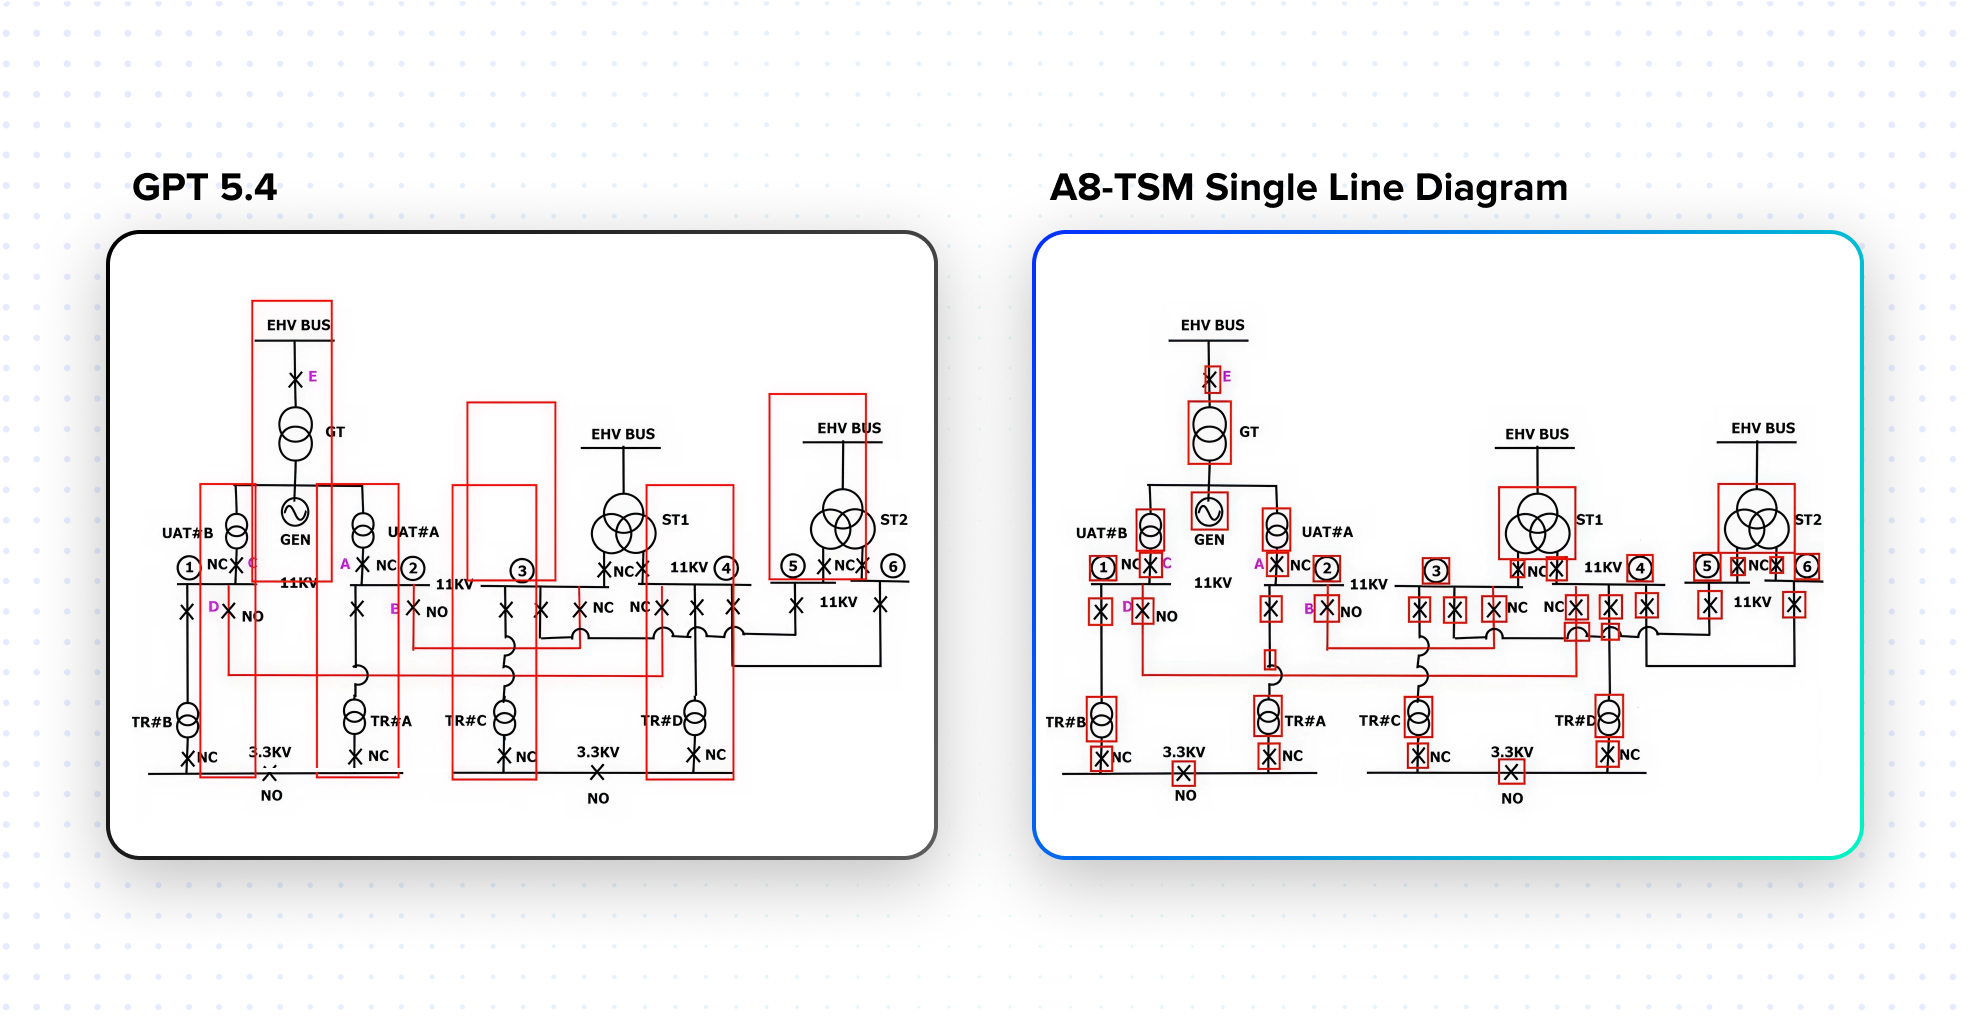
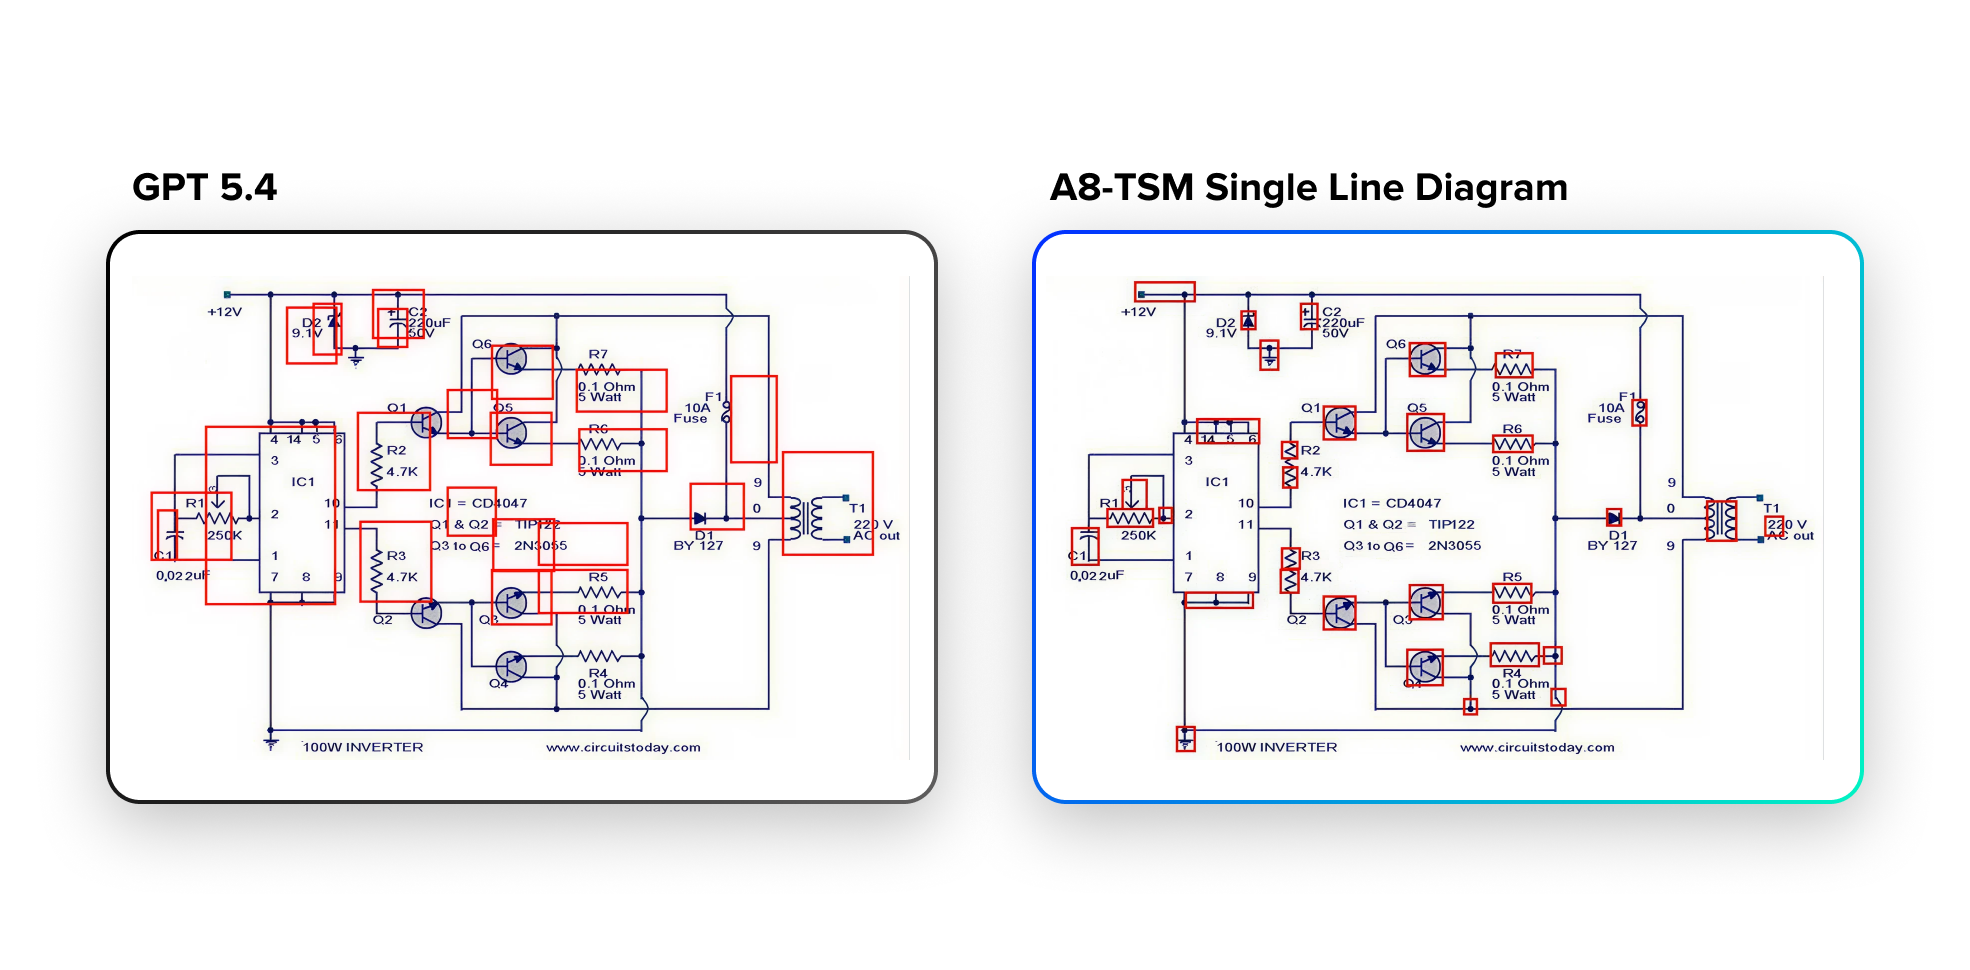
What this means in practice
In an SLD with 126 components, GPT-5.4's recall of 0.17% means it would correctly locate ZERO components with spatial accuracy. A8-TSM-Single Line Diagram's recall of nearly 78% means it would correctly locate approximately 98 of those components with high spatial precision. For an engineering team using AI to automate diagram validation, component mapping, or signal association, that difference is not a performance nuance. It is the difference between a working system and one that cannot be used.
What Makes This Different from General-Purpose AI
General-purpose LLMs, including the most capable multimodal models available today, approach engineering diagrams the way they approach any image: they describe what they see. Most multimodal AI systems caption images, extract text, and perform shallow visual reasoning. The Diagram Understanding Agent goes way further.
It preserves structure rather than flattening it. Instead of converting diagrams into text blobs, it builds graph representations, structured schemas, and relational mappings. A circuit breaker drawn at small scale in a cluttered SLD region carries the same semantic weight as a transformer drawn at ten times the size. A label adjacent to a symbol may reference a signal in an external spreadsheet, not the nearest component. These relationships are invisible to a model not trained to reason about engineering document structure.
It enables multi-hop reasoning. The system can answer questions such as: Which components are impacted if this node fails? What signals are downstream of this subsystem? This requires traversing relationships, understanding dependencies, and maintaining system context across the full diagram, something general-purpose models cannot do reliably for engineering documents.
It delivers auditability and trust. Every output includes confidence scores, traceable mappings, and explainable reasoning paths. In industrial settings, where a misinterpreted specification or missed signal association can cascade into safety incidents, compliance failures, or operational downtime, this is non-negotiable. The agent produces outputs with provenance, so engineers can verify, validate, and trust what the system tells them.
Before and After: The Operational Transformation
| Engineering Challenge | Before | After |
|---|---|---|
| SLD Component Mapping | Hours of expert review per diagram; error-prone cross-referencing against signal sheets | Automated extraction of 60+ components and 100+ text elements per SLD at 96% accuracy |
| Signal-to-Component Association | Manual matching between Excel spreadsheets and diagram visuals; inconsistency across teams | Simultaneous multimodal ingestion of images and tabular data; confidence-scored associations |
| Network Topology Construction | Tedious manual tracing across multiple diagrams; bottleneck for fault isolation | Automated topology map with component-centric and hierarchical views; XML export ready |
| Scalability for New Diagrams | Human-in-the-loop required for every new diagram; throughput severely constrained | Fully automated pipeline applicable to both multimodal and image-only inputs |
| Engineering Decision Support | Insights derived ad hoc from manual review; no structured functional assessment | Automated functional flow summaries, gap analysis, and prioritized corrective action recommendations |
Use Cases Across Industries
The Diagram Understanding Agent is not limited to electrical engineering. The same underlying capability, multimodal perception combined with graph-based reasoning and agentic orchestration, applies across any domain where diagrams are the authoritative source of system knowledge.
Industrial and Energy Single Line Diagrams, P&IDs, and asset topology modeling. Automated substation documentation, faster grid commissioning, and continuous topology validation across energy infrastructure.
Telecommunications Network topology diagrams, configuration and connectivity mapping, and fault isolation across complex communications infrastructure.
Manufacturing Process flow diagrams, system dependency mapping, and operational optimization. Automated P&ID ingestion for process simulation, compliance verification, and change management.
Infrastructure and Buildings HVAC system diagrams, electrical layouts, safety and compliance validation. Intelligent cross-referencing between electrical, mechanical, and controls diagrams that today requires teams of engineers working in parallel.
There is also a knowledge transfer dimension that cuts across all of these industries. Reading P&IDs and single line diagrams is a daily activity for experienced engineers, but it represents a significant learning curve for new team members. Senior engineers often spend considerable time teaching diagram interpretation during onboarding, and that back-and-forth slows delivery. The Diagram Understanding Agent addresses this directly: structured outputs become a persistent, queryable knowledge base that new team members can access without burdening senior staff.
The Bigger Picture: Toward Autonomous Engineering Intelligence
The Diagram Understanding Agent is a key step toward a broader transformation in how industrial enterprises manage and act on the knowledge embedded in their engineering artifacts.
Living digital twins. Systems that continuously update from diagrams and operational data reflect real-world state, and enable simulation and prediction. The structured outputs produced by the agent, topology graphs, component schemas, signal mappings, are the raw material from which accurate digital twins are built and maintained.
Autonomous troubleshooting. AI systems that diagnose issues across complex systems, recommend corrective actions, and learn from historical patterns. The confidence-ranked topology outputs of the agent give troubleshooting workflows a structured starting point, narrowing fault isolation from a multi-hour manual exercise to a targeted, guided process.
Knowledge reuse at scale. Instead of re-analyzing diagrams repeatedly across projects and teams, intelligence is captured once, stored in structured form, and reused across workflows. Teams build on validated intelligence rather than re-engineering from scratch with each new project or diagram revision.
Three macro trends make this moment critical. First, organizations are sitting on thousands of diagrams, PDFs, and engineering artifacts representing largely untapped intelligence. Second, static models are being replaced by coordinated agents capable of task decomposition and autonomous execution, a paradigm that diagram understanding fits naturally into. Third, enterprises are moving beyond proofs of concept and require production-grade AI that is reliable, explainable, and integrated with real workflows. The Diagram Understanding Agent delivers on all three.
Why Gemini Enterprise
Gemini Enterprise matters because enterprises need more than model access. They need a secure, governed, enterprise-ready environment where specialized AI agents can be deployed, used, and integrated into real work.
By making the Table Understanding Agent and Diagram Understanding Agent available on Gemini Enterprise, Articul8 is bringing domain-specific intelligence into a broader platform designed to help organizations search, analyze, summarize, and automate work at scale. That gives enterprises a more practical path to using specialized agents alongside the Gemini models, connected search across enterprise data, and other built-in capabilities already available within Gemini Enterprise.
This is especially important for organizations trying to operationalize AI beyond general-purpose chat and summarization. Domain-specific agents become most valuable when they are easy to access, easy to trust, and easy to embed into the workflows that matter most.
From Static Artifacts to Intelligent Systems
This launch reflects a larger shift in enterprise AI.
Tables and diagrams were never meant to remain static artifacts. They are compressed representations of how businesses, systems, and infrastructure actually work. The challenge has been that most AI systems were not designed to preserve the structure and relationships that make those artifacts meaningful.
Articul8’s new agents change that.
The Table Understanding Agent turns complex tables into structured, model-ready data that can support downstream analytics, compliance, and domain-specific reasoning. The Diagram Understanding Agent transforms engineering diagrams into structured system intelligence that can power troubleshooting, automation, and decision support.
Together, they represent a more practical future for enterprise AI: one where the hardest-to-interpret artifacts in the enterprise are no longer opaque to machines, and where domain-specific agents can finally bring operational intelligence to the information that matters most.
The Table Understanding Agent and Diagram Understanding Agent are now available on Gemini Enterprise.